

How Dollar Cost Averaging affects Portfolio Performance
Article last updated: September 10, 2026
Dollar cost averaging (DCA) is one of the most widely used strategies among individual investors, and one of the most argued about. The claim made for it is that spreading purchases over time reduces the risk of paying too much for an asset just before its price falls. This article sets out what dollar cost averaging is, how it works arithmetically, and what a simulation of $SPY purchases going back to 1994 shows about how it actually affected portfolio performance.
Key takeaways
- Dollar cost averaging is an investment strategy that splits a fixed amount of capital into equal instalments invested at regular intervals, instead of committing the whole amount in one lump sum.
- Dollar cost averaging buys more shares when the price is low and fewer when the price is high, so the average cost per share ends up below the simple average of the prices paid.
- Across yearly simulations of $SPY since 1994, dollar cost averaging produced an average annualized return of +10.02% against +10.42% for lump sum investing, a difference small enough to be within noise.
- Dollar cost averaging reduced maximum drawdown materially in crash years, cutting the 2009 maximum drawdown of a 2008 investment from -51.13% to -43.91%.
- Dollar cost averaging underperforms lump sum investing in rising markets, because each later instalment buys fewer shares at a higher price.
What is dollar cost averaging (DCA)?
Dollar cost averaging, also known as DCA, is an investment strategy that divides the capital you intend to invest into equal smaller amounts and invests one of those amounts at fixed intervals, rather than investing the whole sum at once. An investor with $12,000 to deploy might invest $1,000 on the first trading day of each month for twelve months instead of $12,000 on day one.
Dollar cost averaging is designed to do two things. It reduces the risk of committing the entire amount immediately before a fall, and it removes the need to decide when the market is cheap, a judgement most investors get wrong often enough for it to cost them. The trade-off is that the capital not yet invested is not yet earning anything.
How does dollar cost averaging work?
Dollar cost averaging works because a fixed dollar amount buys more shares when the price is low and fewer when the price is high, which pulls the average cost per share below the simple average of the prices.
Consider $900 invested as three monthly instalments of $300 in a share whose price falls from $30 to $20 to $15:
| Month | Share price | Amount invested | Shares bought |
|---|---|---|---|
| 1 | $30 | $300 | 10 |
| 2 | $20 | $300 | 15 |
| 3 | $15 | $300 | 20 |
| Total | $900 | 45 |
The average cost per share is $900 / 45 = $20.00, while the simple average of the three prices is ($30 + $20 + $15) / 3 = $21.67. The gap exists because the largest number of shares was bought at the lowest price.
The effect on the portfolio is larger than the effect on the average price. Investing the full $900 at $30 buys 30 shares, worth $450 at the month-three price of $15, a loss of 50%. The dollar cost averaged 45 shares are worth $675, a loss of 25%. Dollar cost averaging did not avoid the loss; it halved it. Note that averaging in this way also gives you several purchase lots at different prices, which is what makes cost basis tracking more involved than for a single purchase.
You can run this calculation on real tickers and intervals with the free DCA calculator.
Dollar cost averaging example: investing through the 2008 crash
Dollar cost averaging beat lump sum investing decisively when the purchases straddled the 2008 financial crisis, because the later instalments bought shares at crash prices. The example below invests in $SPY (SPDR S&P 500 ETF Trust) starting at the beginning of 2008, just ahead of the stock market crash.
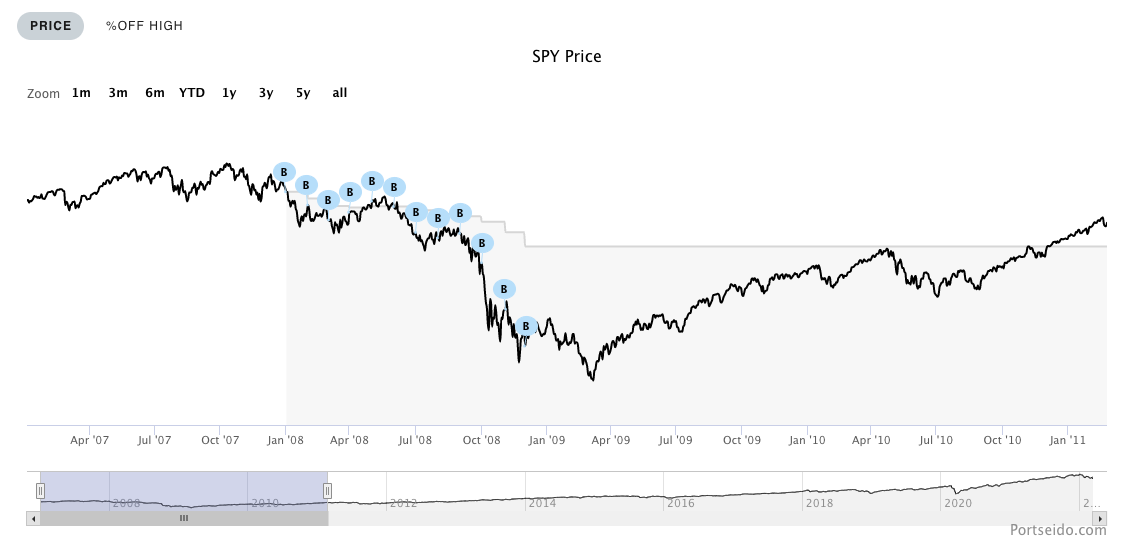
An investment of $10,000 in $SPY at the beginning of 2008 would result in $32,783.62 today. This is equivalent to +227.84% return or +8.76% annualized return. An investment of the same $10,000 with monthly DCA over the 12 months of 2008 would result in $38,628.44 today, or +286.28% return, or +10.03% annualized return.
The difference comes from the shares themselves. Dollar cost averaging kept buying $SPY through the financial crisis rather than committing everything at the pre-crash price. Averaging down during the crisis also reduced the pain of the recovery: the maximum drawdown experienced during 2009 was -43.91% with DCA, against -51.13% without it.
What happens to dollar cost averaging in a rising market?
Dollar cost averaging underperforms lump sum investing in a rising market, because every instalment after the first buys fewer shares at a higher price than the lump sum paid. The 2019 recovery shows the size of the gap.
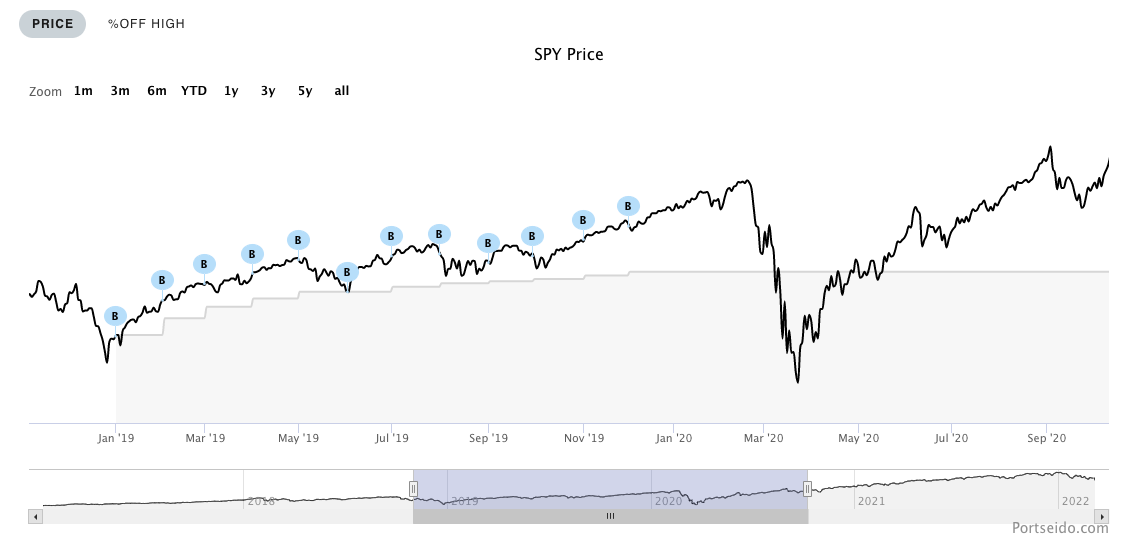
In 2019, when the market recovered strongly, DCA did worse on every metric because the investor was buying fewer shares as the market climbed. With monthly DCA, an investment of $10,000 would give $15,184 today, a return of +51.84% (+14.05% annualized), compared with $17,445.64, a return of +74.46% (+19.17% annualized), without DCA.
This is the honest cost of dollar cost averaging. Markets rise more often than they fall, so the scenario where DCA lags is the more common one, and the scenario where it rescues you is the rarer one.
Is dollar cost averaging better than lump sum investing?
Over the long run, dollar cost averaging and lump sum investing produced almost the same return, with lump sum slightly ahead. The comparison below simulates deploying capital with and without DCA at different starting points since 1994, investing $10,000 at the beginning of any given year against a monthly DCA over the same year.
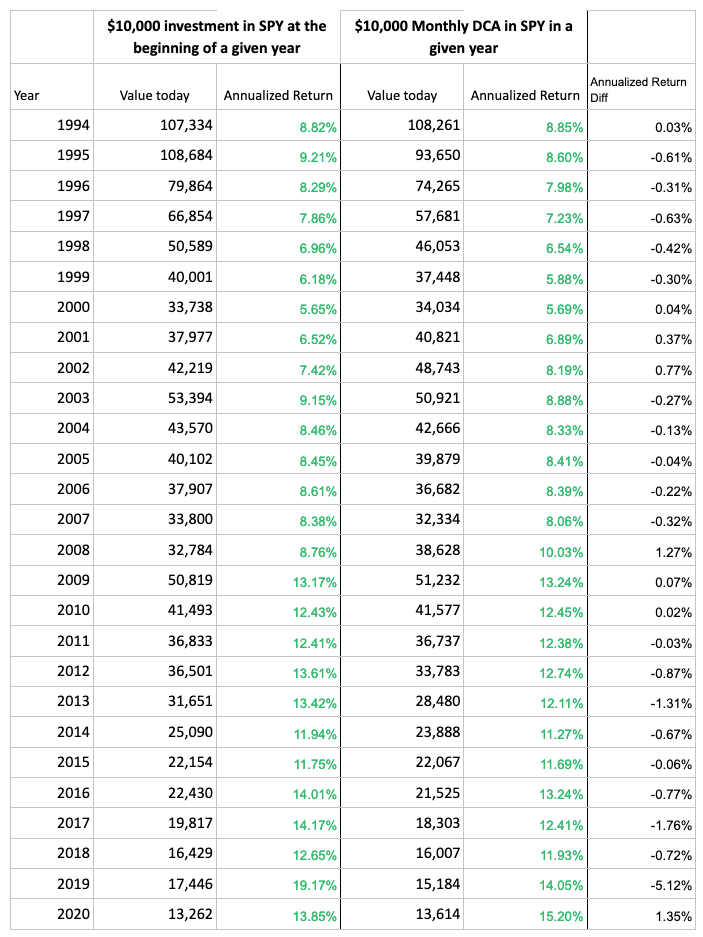
Across those yearly $SPY simulations since 1994, the average annualized return without DCA is +10.42%, and with DCA it is +10.02%. In aggregate, there is not much difference from a return perspective. Excluding the recent years (2017-present), which still have a short time horizon and can overstate the annualized return, the difference is smaller still, at +9.63% and +9.44% respectively.
| Lump sum | Monthly DCA | |
|---|---|---|
| Average annualized return, all years | +10.42% | +10.02% |
| Average annualized return, excluding 2017-present | +9.63% | +9.44% |
The conclusion is not that one strategy wins. It is that the return difference is small, which means the choice between them should be made on the risk side rather than the return side. For most portfolios, how capital is split across asset classes does more to shape the outcome than whether it was invested all at once or in twelve instalments.
Does dollar cost averaging reduce drawdown?
Dollar cost averaging reduced maximum drawdown in every crash year examined, which is where its real benefit sits. Maximum drawdown is the largest peak-to-trough fall a portfolio suffers, and it is the number that decides whether an investor sells at the bottom.
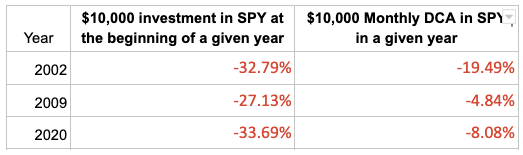
A DCA-based strategy shone most in 2002, 2009 and 2020, the years when the stock market retracted sharply. In each of those years the drawdown of the dollar cost averaged portfolio was materially shallower than the lump sum portfolio's, because a portion of the capital had not yet been exposed when the fall began. If you are unsure how deep your own portfolio has fallen from its high, tracking maximum drawdown is the measure that answers it.
What dollar cost averaging achieves is the avoidance of an extreme. Buying an asset at its highest price is always painful, and DCA makes that outcome less likely, at the cost of making the best outcome less likely too.
When does dollar cost averaging not help?
Dollar cost averaging does not help when the market rises steadily through the investment window, when the instalments are so small that trading costs eat the difference, or when the money would otherwise sit in cash for years.
- Rising markets. Each instalment after the first pays more per share than a lump sum would have, so the strategy gives up return.
- Long deferral of capital. Spreading a lump sum over three years leaves most of it uninvested for most of that time, earning nothing.
- Small instalments with fixed costs. A flat commission per trade is a much larger percentage of a $100 purchase than of a $1,200 one.
- Confusing DCA with regular saving. Investing each paycheque as it arrives is not dollar cost averaging in the strict sense, because there was never a lump sum to deploy. It is simply investing money when you get it.
The strongest criticism of dollar cost averaging is that it is a behavioural tool rather than a return-maximising one. If an investor would panic and sell after committing everything the day before a crash, dollar cost averaging is worth its small expected cost. If they would not, lump sum investing has the edge.
Frequently asked questions
How often should you dollar cost average?
Monthly is the most common interval for dollar cost averaging, because it matches how most people are paid and keeps per-trade costs proportionate. Weekly instalments smooth the purchase price slightly more but multiply commissions and admin. The interval matters far less than the total window: spreading a lump sum over twelve months has a very different effect from spreading it over three.
Does dollar cost averaging work for individual stocks?
Dollar cost averaging works mechanically for any asset, but it does not protect against a company that is permanently impaired. Averaging into a falling index buys more of a recovering market; averaging into a falling single stock can mean repeatedly buying more of a failing business. The strategy lowers your average cost, it does not improve the underlying investment.
Should you keep dollar cost averaging during a crash?
Continuing to invest during a crash is precisely when dollar cost averaging earns its keep, because those instalments buy the most shares per dollar. In the 2008 example, the DCA portfolio finished ahead specifically because it kept buying $SPY through the crisis. Stopping the plan at the bottom converts the strategy's main advantage into its main disadvantage.
How do you calculate the average cost of a DCA position?
Divide the total amount invested by the total number of shares bought across all instalments. Nine hundred dollars invested in three $300 instalments that bought 10, 15 and 20 shares gives 45 shares at an average cost of $20.00 per share. This figure is the position's cost basis per share, and it is what your gain or loss is measured against.
How to track a dollar cost averaging plan in Portseido
Portseido is a portfolio tracker that keeps a running record of a dollar cost averaging plan without a spreadsheet. It consolidates holdings across brokers and currencies, tracks the cost basis built up across every instalment, and calculates time-weighted and money-weighted returns, which matters for DCA because regular contributions make simple return misleading. It also reports drawdown and allocation, and benchmarks the portfolio against indices and ETFs, so you can compare your averaged-in position against the index you were averaging into.
Portseido tracks and reports on your portfolio; it does not give buy or sell recommendations, and it will not tell you whether to average in or invest a lump sum. There is a free plan, and paid features come with a 14-day trial that does not need a credit card. Try Portseido free
The purpose of this article is to show how dollar cost averaging affected portfolio performance in the past. Nothing contained in this article should be construed as investment advice.