

Cathie Wood ARK Portfolio Analysis 2025
Article last updated: December 23, 2025
Cathie Wood founded ARK Investment Management in 2014 and built it around a single idea: concentrate capital in companies expected to drive disruptive innovation, and accept the volatility that comes with it. Her flagship ARK Innovation strategy became a household name during the 2020 boom and then gave much of it back. This analysis loads ARK's publicly available 13F filings into the Portseido portfolio tracker to see what the 2017-2025 data shows about performance, concentration and risk.
Disclaimer: This analysis is based on publicly available 13F data from 2017-2025. Trade dates and prices are estimated at quarter-end. Some tickers may be missing. The actual dollar value must be multiplied by 1 million for real scale. Every figure below reflects that dataset as of the December 2025 analysis and has not been recalculated since.
Key takeaways
- Cathie Wood's ARK portfolio showed a time-weighted return of +233.28% and a money-weighted return of -34.97% in the 2017-2025 13F data analysed here, a gap caused by when capital arrived rather than by the stock picks.
- Cathie Wood's ARK portfolio is concentrated: the top ten holdings were roughly half of its value in the 2025 data, led by Tesla at 9.71%, across a base of more than 200 holdings.
- Cathie Wood's ARK portfolio swung from +171.90% in 2020 to -61.35% in 2022 in this dataset, a range that makes it a high-beta strategy rather than a core holding for most investors.
- A -61.35% drawdown of the kind ARK recorded in 2022 requires a subsequent gain of about 158% just to return to the starting value, which is why deep losses compound into lost years.
- Cathie Wood's ARK portfolio had a trailing twelve-month yield of 0.09% in the 2025 data, so it is a capital-appreciation strategy and not a source of investment income.
What is Cathie Wood's ARK portfolio?
Cathie Wood's ARK portfolio is a set of actively managed, high-conviction positions in companies ARK Investment Management expects to benefit from disruptive innovation, concentrated in technology, genomics, fintech and related themes.
ARK's strategy is the opposite of an index approach: rather than owning the market, it takes large positions in a small number of names it believes the market has mispriced. That produces the two features visible throughout the 2017-2025 data below — exceptional returns when growth is rewarded, and severe drawdowns when it is not. It contrasts sharply with the value-oriented Warren Buffett portfolio analysed in the previous episode, which is concentrated in a handful of established, cash-generating businesses rather than in growth themes.
Why do ARK's time-weighted and money-weighted returns differ so much?
Cathie Wood's ARK portfolio showed a time-weighted return of +233.28% and a money-weighted return of -34.97% in the 2017-2025 analysis, because most of the capital arrived after the largest gains had already happened.
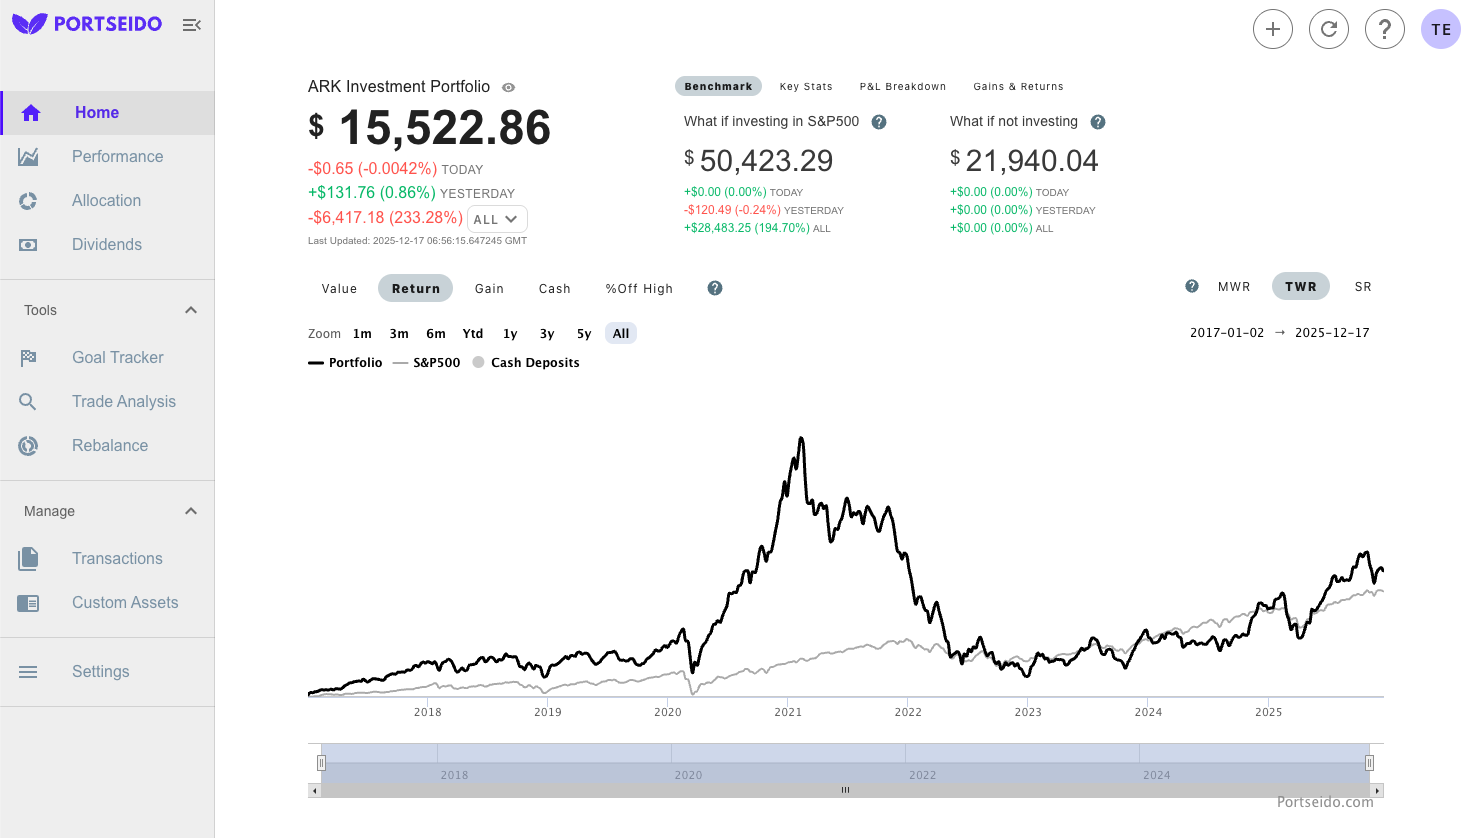
Time-weighted return measures how the investments themselves performed, treating every period equally regardless of how much money was invested at the time. At +233.28%, it says the strategy worked for someone who invested a lump sum at the start of the tracked period and never added or withdrew.
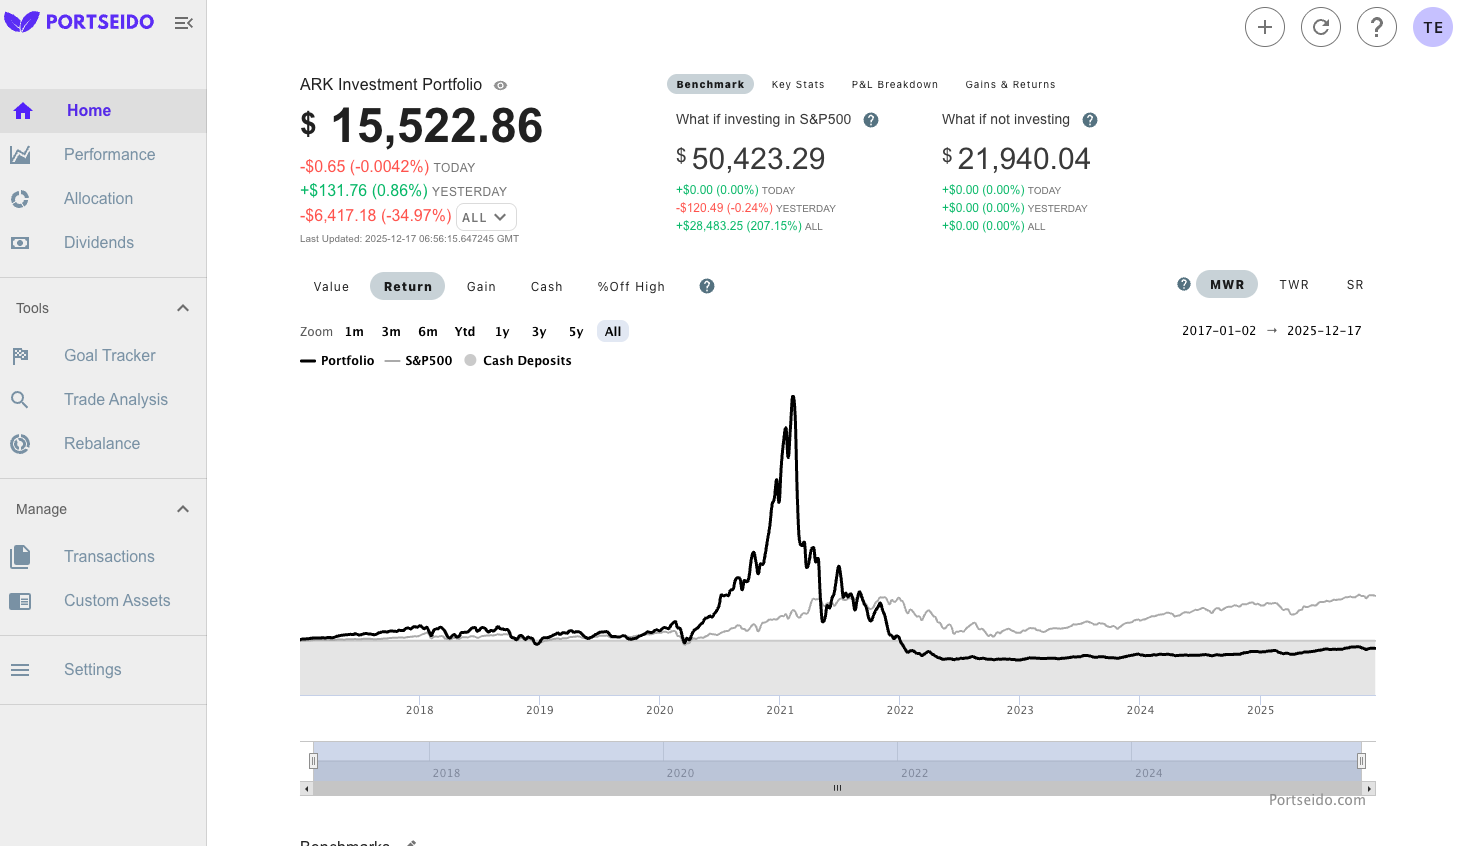
Money-weighted return counts the size and timing of every cash flow, so it measures what investors collectively earned. At -34.97%, it says the bulk of the capital arrived late, after the run-up. The portfolio value in the tracked dataset sits at $15,522, and the benchmark comparison puts the same capital deployed into the S&P 500 over the identical timeframe at a projected $50,423.29, an approximate +207.15% on a money-weighted basis.
The gap between the two figures is the lesson of this analysis, and it is not unique to ARK: whenever money chases a strategy after it has already performed, the published return and the investor's return separate. Settling the difference between simple return, time-weighted return and money-weighted return is worth doing before comparing yourself with any fund.
How has Cathie Wood's ARK portfolio performed year by year?
Cathie Wood's ARK portfolio recorded swings from +171.90% in 2020 to -61.35% in 2022 in the 2017-2025 data, a year-to-year range far wider than the S&P 500 over the same period.
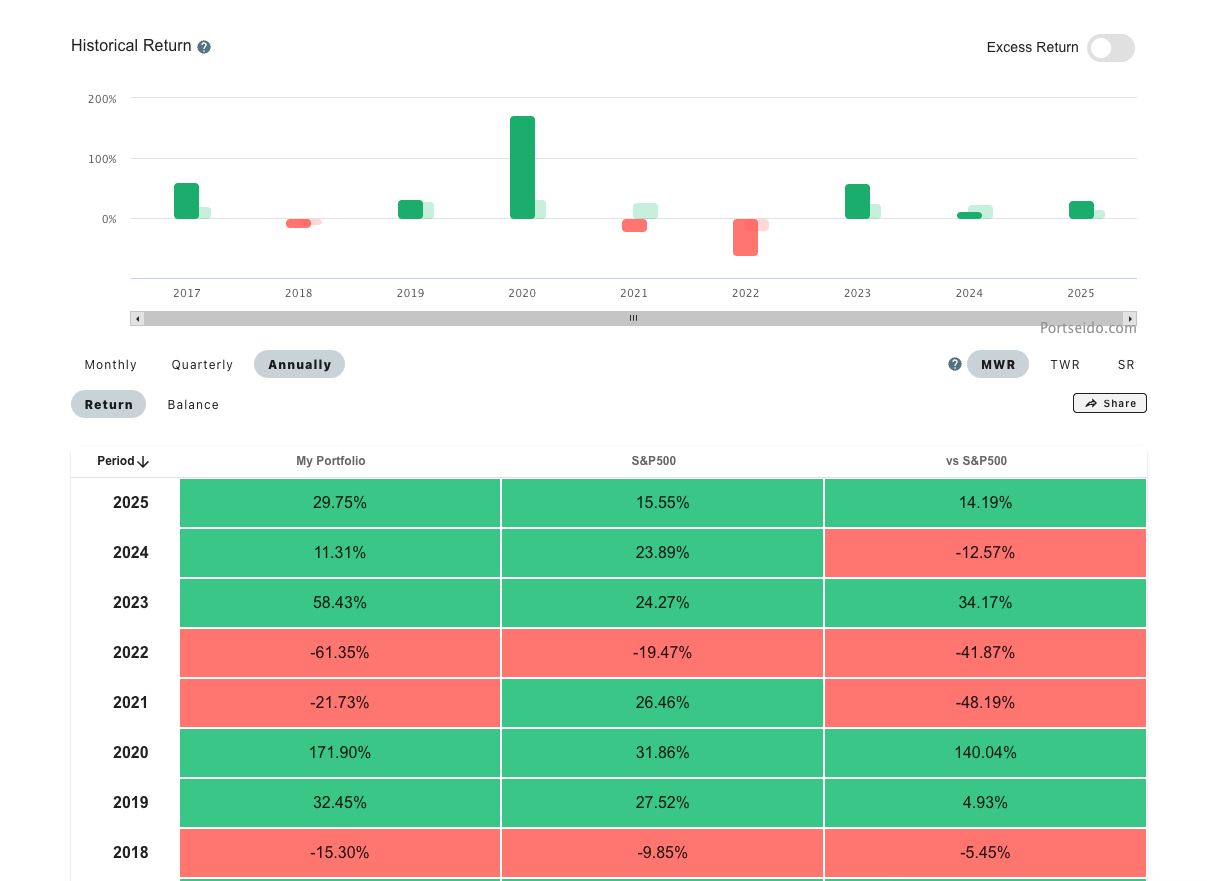
The annual money-weighted breakdown in the tracked data reads as follows:
| Year | ARK portfolio | Versus the S&P 500 |
|---|---|---|
| 2020 | +171.90% | Outperformed by 140.04 percentage points |
| 2021 | -21.73% | S&P 500 climbed +26.46% |
| 2022 | -61.35% | Underperformed by 41.87 percentage points |
| 2023 | +58.43% | S&P 500 gained +24.27% |
| 2024 | +11.31% | S&P 500 gained +23.89% |
| 2025 (YTD) | +29.75% | S&P 500 gained +15.55% |
Two years carry the story. 2020 was the breakout, when pandemic-era liquidity flowed into disruptive innovation. 2022 was the crash, when rising rates repriced long-duration growth stocks and the portfolio fell -61.35%.
The asymmetry matters more than the averages. A 20% decline recovers in months during a bull market; a 60% decline needs years of exceptional performance before the position is merely back where it started. That relationship is why maximum drawdown tells you more about a high-growth strategy than its best year does.
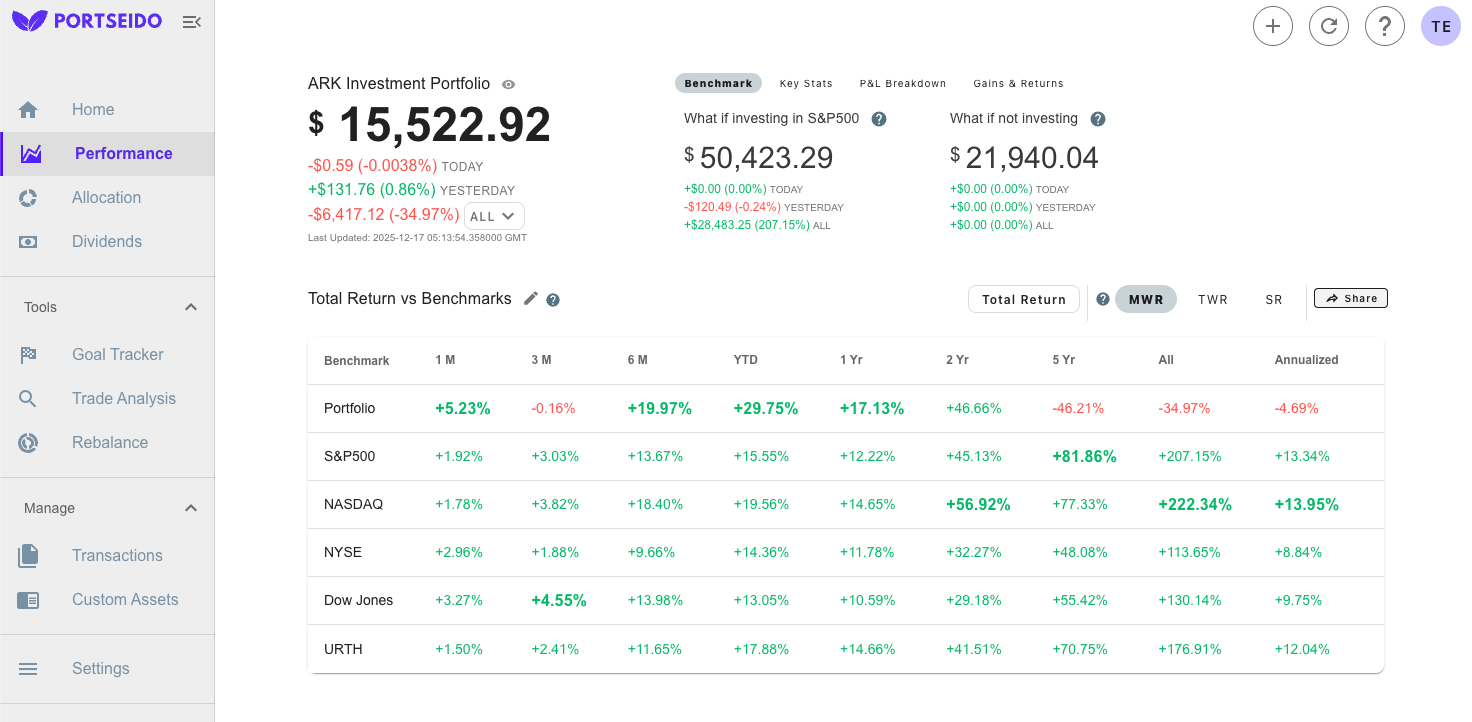
The benchmark view in the tracked data shows ARK trailing the NASDAQ, which is more growth-heavy, while sitting ahead of the broader S&P 500 on that chart's basis. Read it alongside the -34.97% money-weighted figure rather than instead of it: the two answer different questions, one about how the holdings performed and one about what investors in them earned.
What are the top holdings in Cathie Wood's ARK portfolio?
The top ten holdings in Cathie Wood's ARK portfolio made up roughly half of its value in the 2025 filing data, led by Tesla at 9.71%, out of a base of more than 200 holdings.
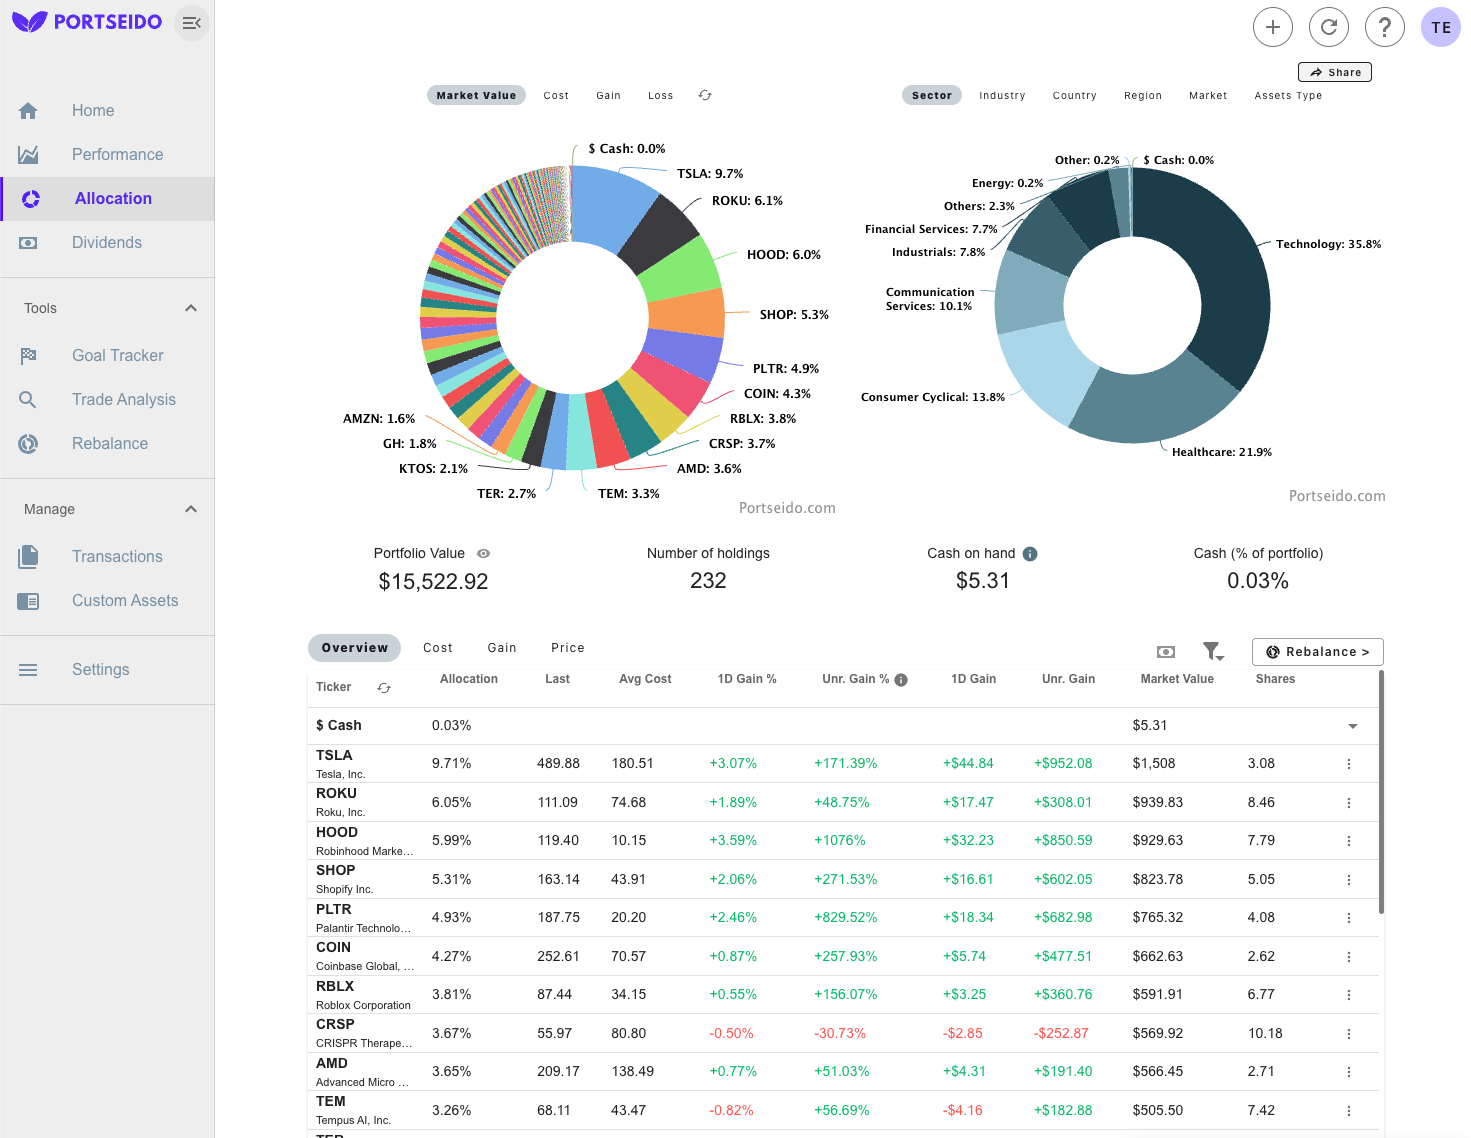
- Tesla (TSLA) — 9.71%
- Roku (ROKU) — 6.05%
- Robinhood Markets (HOOD) — 5.99%
- Shopify (SHOP) — 5.31%
- Palantir Technologies (PLTR) — 4.93%
- Coinbase (COIN) — 4.27%
- Roblox (RBLX) — 3.81%
- CRISPR Therapeutics (CRSP) — 3.67%
- Advanced Micro Devices (AMD) — 3.65%
- Tempus AI (TEM) — 3.26%
By sector, the same 2025 data is weighted towards technology and the sectors that intersect with it: Technology 35.8%, Healthcare 21.9% (largely genomics and biotech), Consumer Cyclical 13.6% and Communication Services 10.1%.
The structure is a long tail behind a concentrated head. Two hundred-plus holdings sounds diversified, but with half the value in ten names, the portfolio weight of the tail positions is too small to contribute much either way. Technology and healthcare together are over half the portfolio, so the holdings also tend to rise and fall on the same macro news.
Which ARK positions produced the biggest gains?
The largest unrealised gains in Cathie Wood's ARK portfolio in the 2025 data came from Robinhood at +1,076%, Palantir at +829.52% and Shopify at +271.53%.
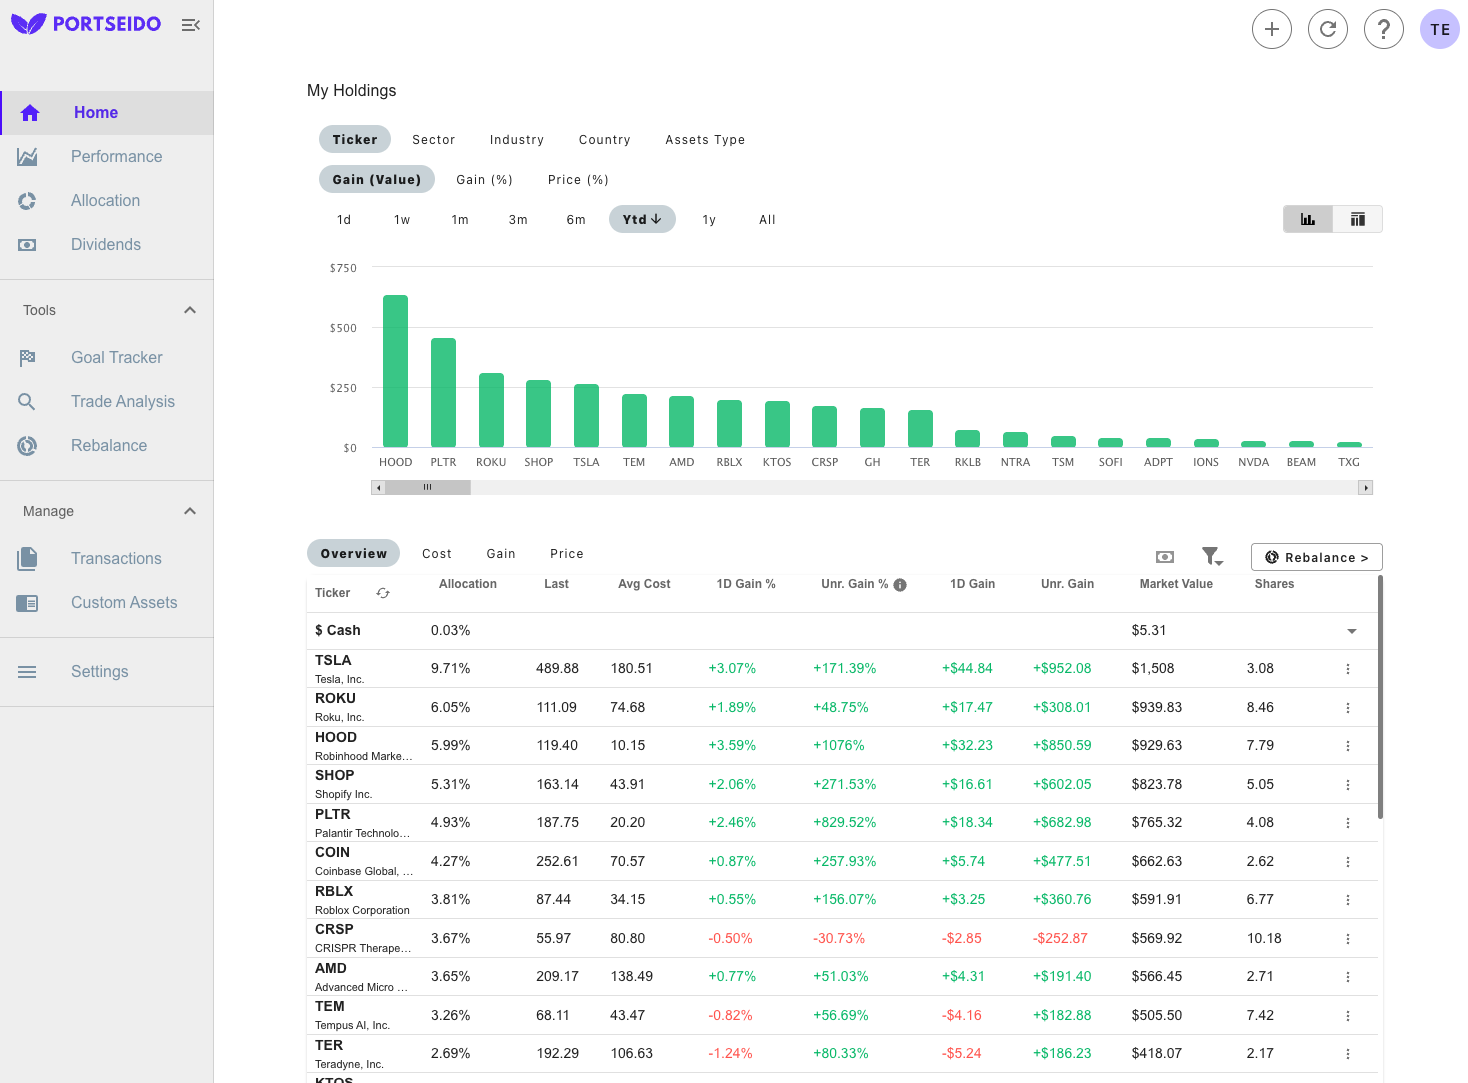
- Robinhood (HOOD): +1,076%, from an average cost of $10.15 to $119.40 at the time of the analysis, held through a long period of scepticism about the business model.
- Palantir (PLTR): +829.52%, from an average cost of $20.20 to $187.75, an early position in AI-driven data analytics.
- Shopify (SHOP): +271.53%, from an average cost of $43.91 to $163.14, on the acceleration in digital retail.
- Coinbase (COIN): +257.93%, from an average cost of $70.57 to $252.61, tied to digital asset adoption cycles.
- Tesla (TSLA): +171.39%, from an average cost of $180.51 to $489.88, the portfolio's largest position by weight.
These are unrealised figures measured against average cost, so they describe positions still held rather than completed round trips. They also make the concentration argument in both directions: a handful of holdings produced most of the upside, and the same structure turned 2022 into a -61.35% year.
Does Cathie Wood's ARK portfolio pay dividends?
Cathie Wood's ARK portfolio produces almost no dividend income, with a trailing twelve-month portfolio yield of 0.09% in the 2025 data.
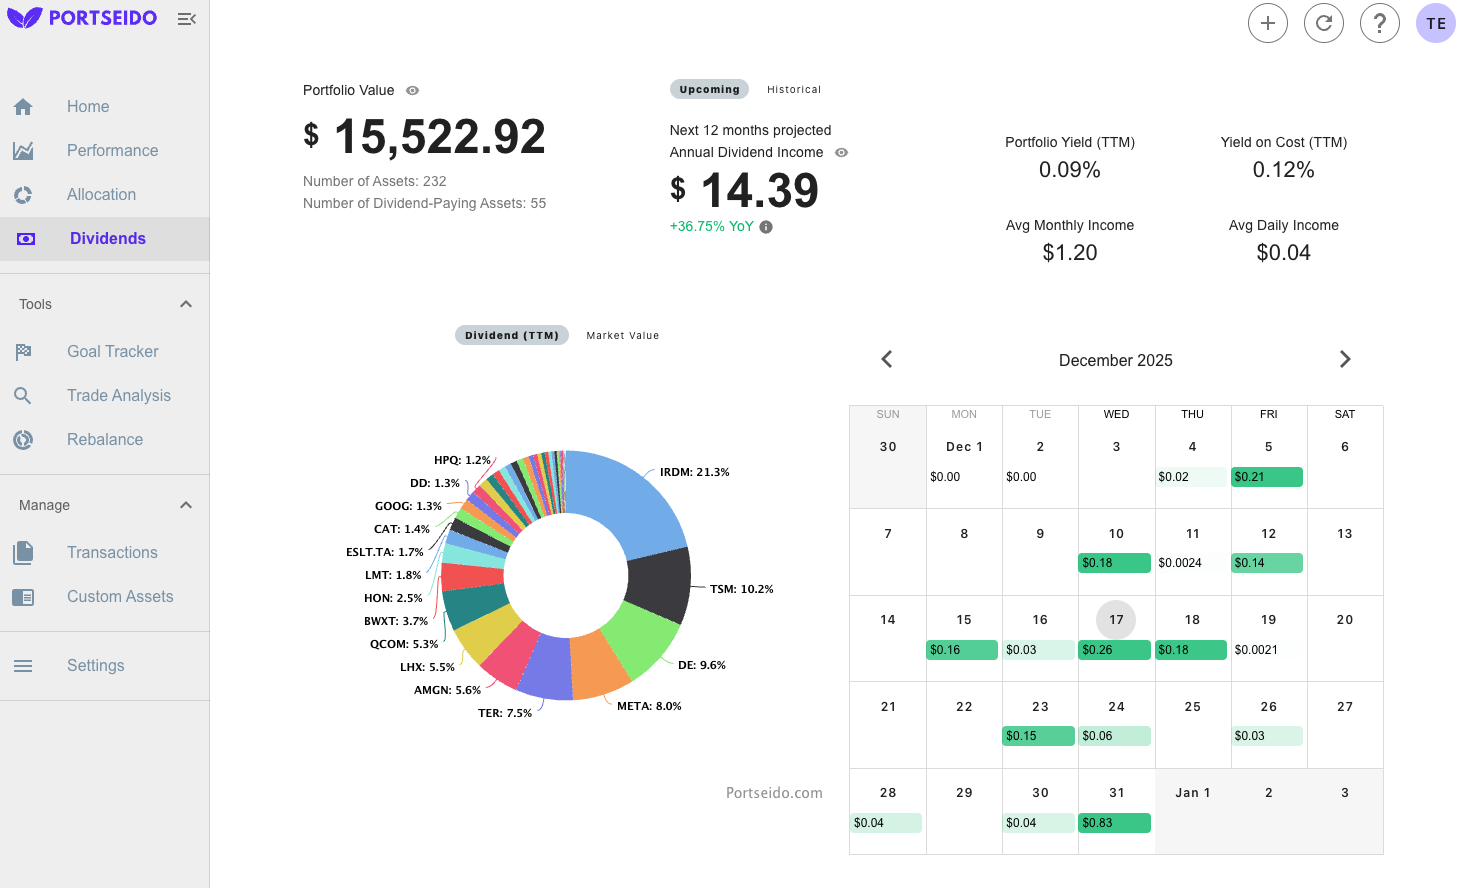
That is by design. High-growth companies typically reinvest earnings into research, expansion and acquisitions rather than paying them out, so a portfolio built around disruptive innovation shows a near-zero yield almost by construction, and all of its return has to come from capital appreciation.
The consequence is that ARK is not a vehicle for an income investor, who would be selecting on dividend yield and payout consistency instead. It also means there is no dividend cushion during a drawdown: in a year like 2022, a 0.09% yield offsets essentially none of a -61.35% decline.
What can investors learn from Cathie Wood's ARK portfolio?
The 2017-2025 data on Cathie Wood's ARK portfolio produces three lessons that apply to any concentrated growth strategy, not just this one.
- The published return is not your return. A +233.28% time-weighted return alongside a -34.97% money-weighted return shows that entry timing can invert the outcome of a strategy that genuinely worked.
- A few positions carry the portfolio. Gains of +1,076% in Robinhood, +829.52% in Palantir and +271.53% in Shopify mattered more than the entire long tail of holdings combined.
- Drawdown mathematics is unforgiving. The -61.35% fall in 2022 required roughly a 158% gain to return to break-even, while a 19% index decline needs about 24%. Deep losses cost years, not months.
Over the 2020-2025 stretch covered here, the strategy underperformed a diversified index approach on a multi-year basis, which is an argument for sizing this kind of exposure deliberately rather than an argument against holding any of it.
Frequently asked questions
What is a 13F filing and what does it show about ARK?
A Form 13F is a quarterly report that US institutional investment managers with over $100 million in qualifying assets must file with the SEC, listing their US-listed equity positions. It is filed within 45 days of quarter end, so it always describes the past. A 13F shows positions held at a date, not the individual trades, which is why any analysis built on it estimates trade dates and prices.
How much does a portfolio need to gain to recover a 61% loss?
A portfolio that falls 61% needs a gain of about 158% to return to its starting value, because the recovery is calculated on the smaller remaining balance. The formula is 1 divided by the remaining fraction, minus one: 1 / 0.39 - 1 = 1.58. The same arithmetic makes a 19% decline need only about 24% to recover.
Why can a fund's published return differ from what its investors earned?
A fund's published return is normally time-weighted, which ignores when investors put money in, while an individual's return is money-weighted and depends entirely on it. If most money arrives after a strong run, the average investor's money-weighted return can be negative while the fund's published time-weighted return is strongly positive.
Is a concentrated growth portfolio suitable as a core holding?
A concentrated growth portfolio behaves as a satellite position rather than a core one for most investors, because its range of outcomes is wide enough to change a financial plan on its own. The decisive question is not the expected return but whether you would hold the position through a 60% decline, since selling inside one converts volatility into a permanent loss.
How to track a high-growth portfolio in Portseido
Portseido is the portfolio tracker used to produce this analysis, and it applies the same measurements to a personal portfolio. It consolidates holdings across multiple brokers and currencies, reports time-weighted and money-weighted returns side by side so the gap between strategy performance and your own entry timing is visible, tracks cost basis, records dividends and yield on cost, benchmarks against indices and ETFs, and shows allocation and drawdown.
For a growth-heavy portfolio, the drawdown and allocation views are the ones that do the work, because they show concentration and the depth of past declines rather than only the headline gain. Portseido tracks and reports on your portfolio; it does not give buy or sell recommendations. There is a free plan, and paid features come with a 14-day trial that does not need a credit card. Try Portseido free