

Warren Buffett Portfolio Analysis 2025
Article last updated: August 1, 2025
Warren Buffett's Berkshire Hathaway equity portfolio is one of the few large portfolios the public can inspect in detail, because US institutional managers must disclose their US-listed stock positions every quarter on Form 13F. This analysis loads over a decade of Berkshire Hathaway's publicly available 13F data into the Portseido portfolio tracker and reports what the filings through mid-2025 show about performance, concentration, dividends and trading activity.
Disclaimer: This analysis is based on publicly available 13F data from 2013-2025. Trade dates and prices are estimated at quarter-end. The analysis excludes Berkshire Hathaway's large cash holdings to focus specifically on the performance of its equity portfolio. TWR return calculation method is used in this analysis. Every figure below reflects that 2013-2025 dataset as of the August 2025 analysis and has not been recalculated since.
Key takeaways
- Warren Buffett's Berkshire Hathaway equity portfolio was valued at over $266 billion across 39 holdings in the 2013-2025 13F dataset analysed here as of August 2025.
- Warren Buffett's equity portfolio returned an annualised 10.87% on a time-weighted basis from 2013 to 2025, slightly behind the S&P 500's 12.03% over the same window.
- Warren Buffett's portfolio is highly concentrated: the top three positions were more than half of the equity portfolio and the top ten were 87.6% of it in the 2025 filing data.
- Warren Buffett's portfolio held a yield on cost of 3.25% against a current dividend yield of 1.81% in the 2025 analysis, the arithmetic result of buying dividend payers years before.
- Warren Buffett trades more than his "buy and hold" reputation suggests, with 101 trades in 2020 and $176 billion of stock sold in 2024, while portfolio turnover stayed near 14%.
How has Warren Buffett's portfolio performed?
Warren Buffett's Berkshire Hathaway equity portfolio grew to over $266 billion in the 2013-2025 period covered by this analysis, with a beta of 1.01 and a maximum drawdown of -39.14% that took 451 days to recover.
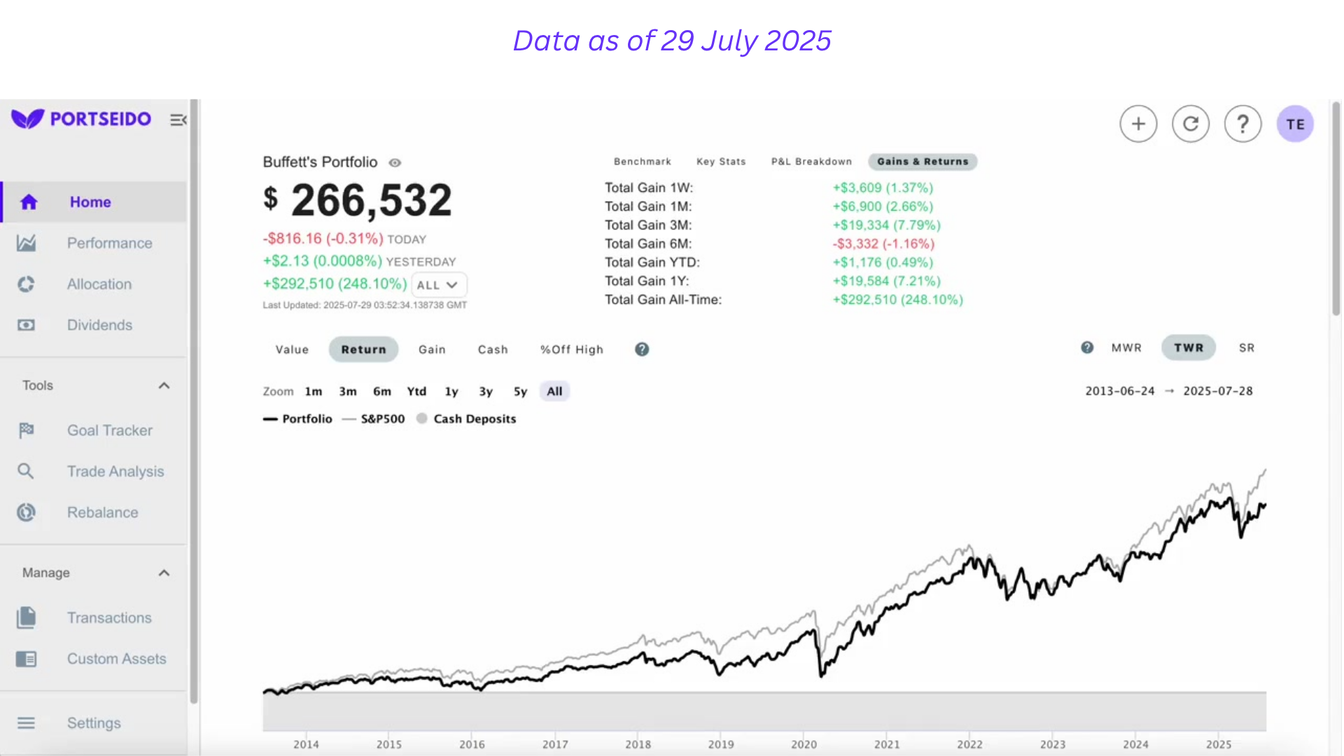
The growth line is not smooth. The sharp dip in early 2020 shows the equity portfolio taking the full force of the COVID-19 crash, which is the single largest decline in the tracked period.
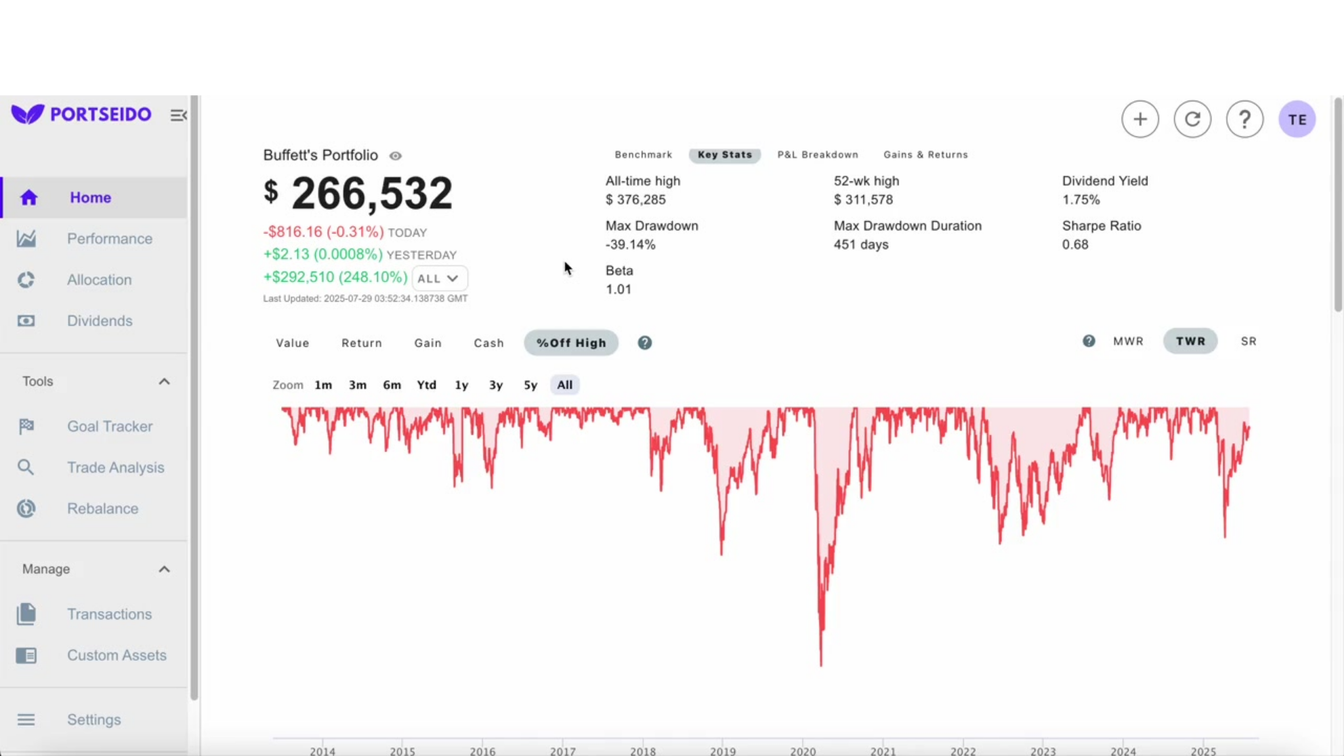
Three statistics from that 2025 snapshot describe the risk taken. A beta of 1.01 means the portfolio moved almost exactly in line with the broader market, since beta measures sensitivity to market movements with 1.0 as the market itself. A max drawdown of -39.14% is the worst peak-to-trough fall it suffered. The drawdown duration of 451 days is the more demanding number: recovering from that bottom took over a year of holding through the decline, which is what tracking drawdown is meant to make visible in advance.
What is in Warren Buffett's portfolio?
Warren Buffett's Berkshire Hathaway equity portfolio held 39 assets in the 13F data analysed here, with the ten largest positions accounting for 87.6% of its value as of the 2025 filing period.
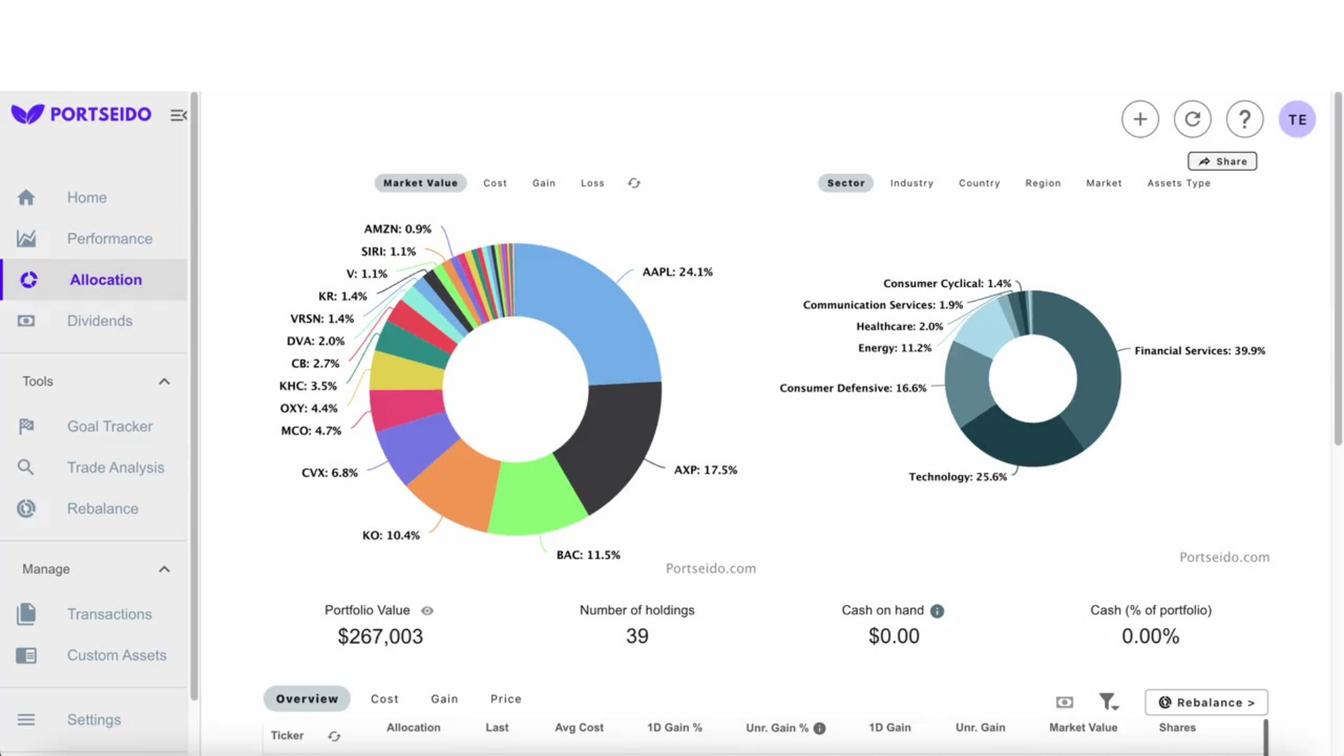
The top ten holdings in that filing period were:
- Apple (AAPL): 24.1%
- American Express (AXP): 17.5%
- Bank of America (BAC): 11.5%
- Coca-Cola Co (KO): 10.4%
- Chevron Corp (CVX): 6.8%
- Moody's Corp (MCO): 4.7%
- Occidental Petroleum Corp (OXY): 4.4%
- Kraft Heinz Co (KHC): 3.5%
- Chubb Ltd (CB): 2.7%
- Davita Inc (DVA): 2.0%
The top three positions alone account for more than half of the entire equity portfolio. That is not diversification in the conventional sense; it is a deliberate concentration in a few businesses. On diversification, Buffett and Munger even stated "Three wonderful businesses will be better than a hundred average businesses." By sector, the same 2025 data shows a heavy tilt towards Financial Services (39.9%) and Technology (25.6%).
A portfolio this concentrated sits at the far end of the debate over how many stocks an investor should own, where theory points to 20 to 30 names and practitioners like Buffett hold far fewer.
Does Warren Buffett still beat the S&P 500?
Over the 2013-2025 period covered by this analysis, Warren Buffett's equity portfolio returned an annualised 10.87% while the S&P 500 returned 12.03%, so the index edged him out over the full window.
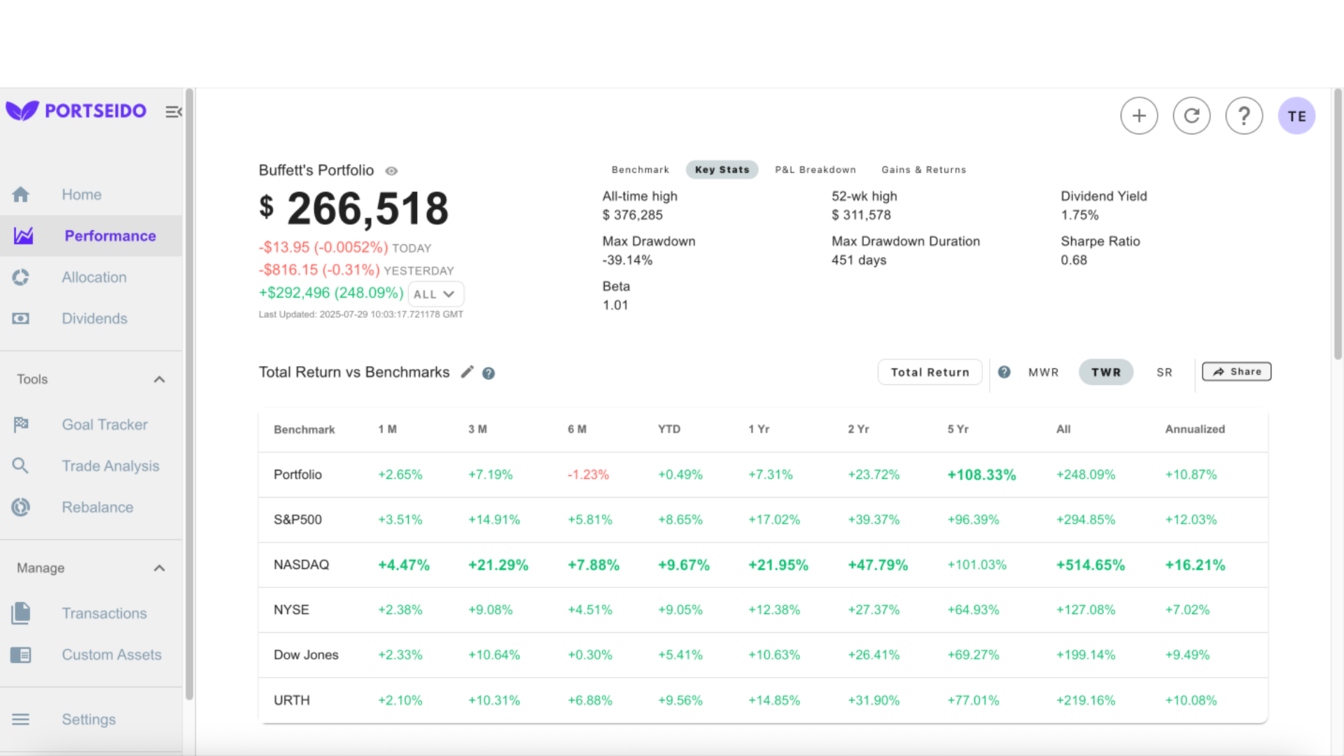
That single number hides a lot. A year-by-year breakdown of the same dataset shows outperformance arriving in bursts rather than steadily.
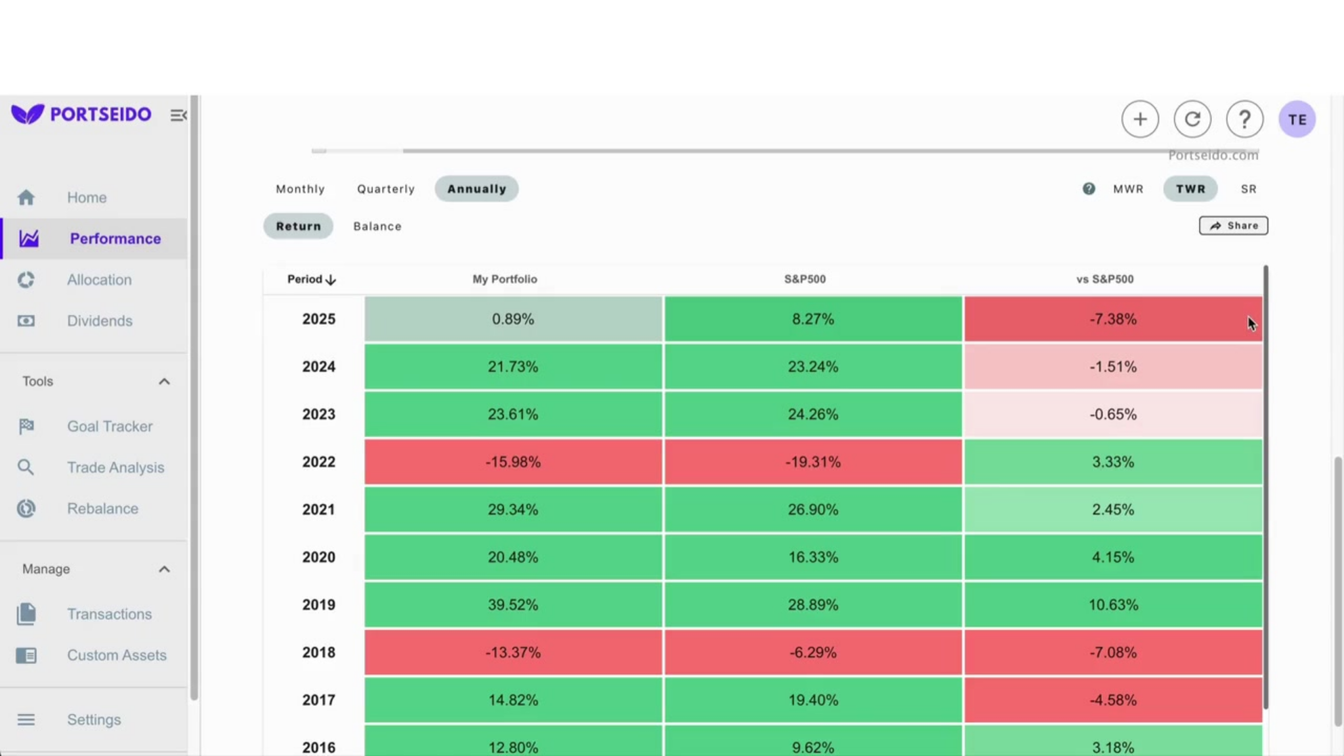
In some years, such as 2019, Buffett's portfolio beat the market by over 10 percentage points. In others it lagged. Two caveats belong with any comparison of this kind: 13F data covers only US-listed equity positions and excludes Berkshire's cash, bonds and wholly-owned businesses, and the result depends on the start date chosen. Running the same test on your own holdings is a matter of benchmarking the portfolio against an index over a period you did not pick after the fact.
How much dividend income does Warren Buffett's portfolio generate?
Warren Buffett's equity portfolio was projected to generate nearly $4.8 billion in annual dividend income in the 2025 analysis, with 29 of its 39 holdings paying a dividend.
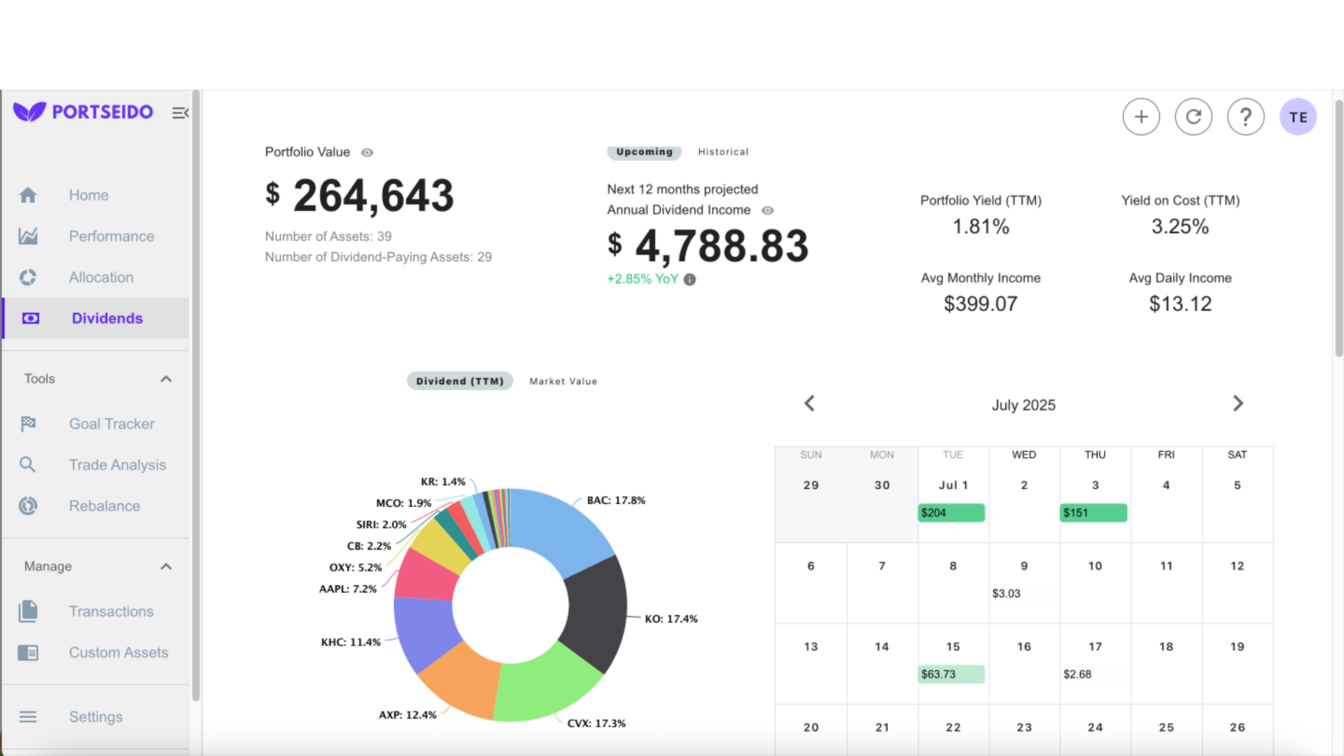
The revealing figure is the yield on cost of 3.25% against a current dividend yield of 1.81% in that same 2025 snapshot. Yield on cost divides the current annual dividend by the price originally paid, rather than by today's price. A yield on cost well above the current yield means the shares were bought years earlier at much lower prices, and the dividend has grown since. It is a description of holding period, not of stock selection: a new buyer of the identical stocks today would receive the 1.81%.
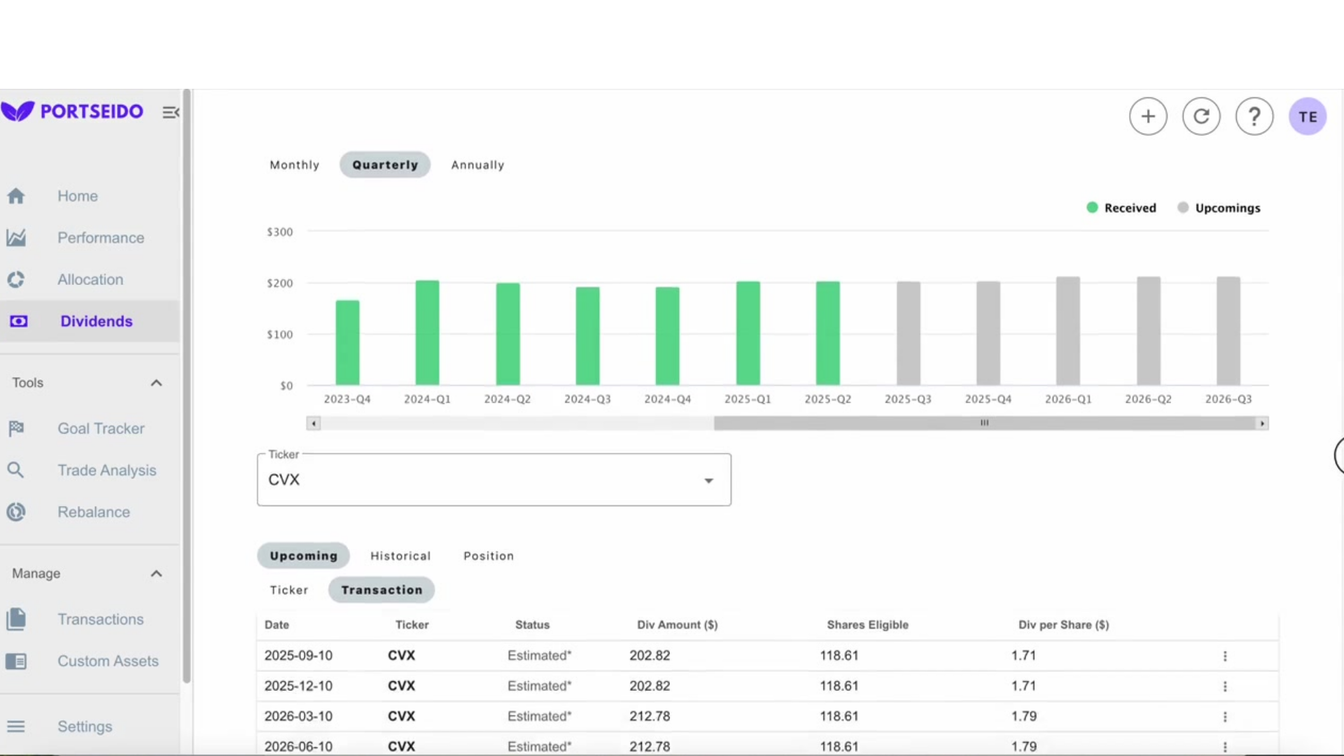
Drilling into a single holding shows where that income comes from. Chevron (CVX) alone contributed a consistent payment of around $200 million every quarter in the projected dividend schedule.
How often does Warren Buffett trade?
Warren Buffett trades considerably more than his "buy and hold" reputation implies: the 13F data records 101 trades in 2020 and $176 billion of stock sold in 2024, while portfolio turnover stayed near 14% even in the most active year.
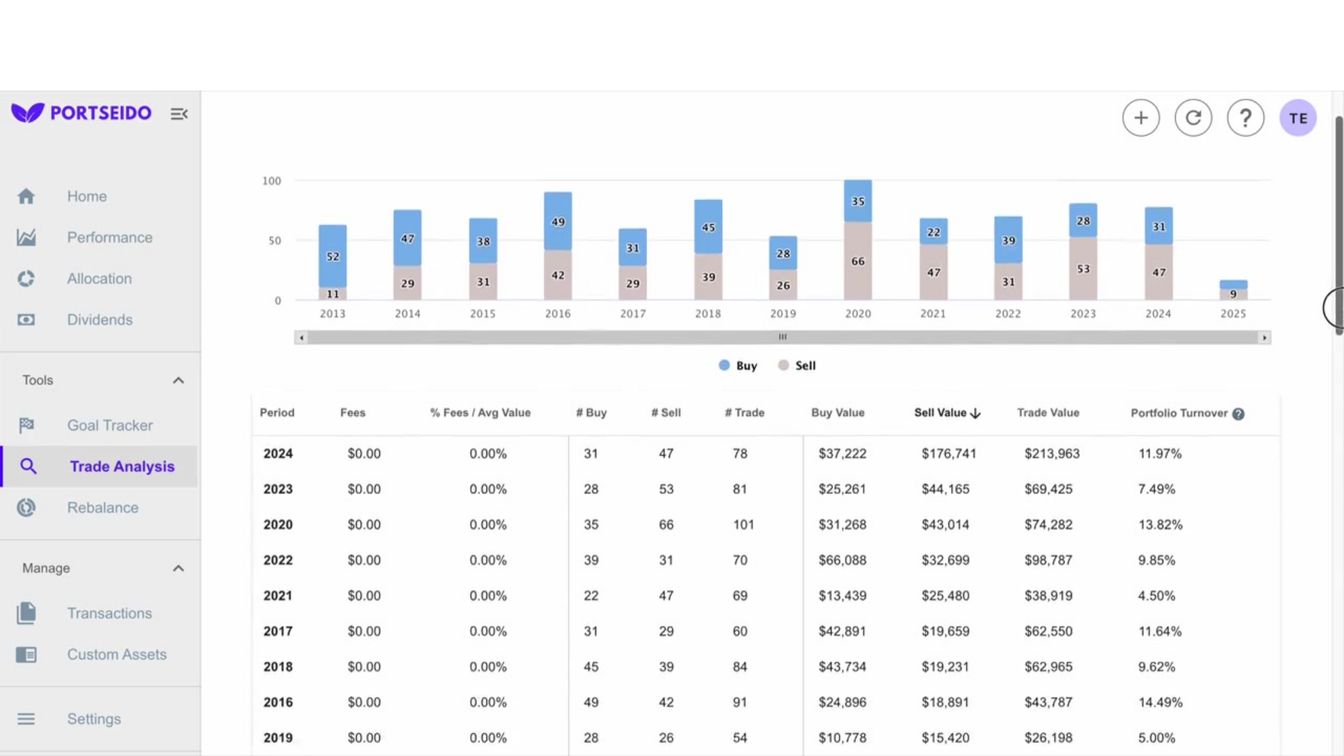
2020 was the busiest year for trade count in the tracked period, with 101 total trades made during the market disruption of that year. 2024 was the largest by value: Berkshire sold a reported $176 billion of stock, a clear pattern of trimming positions and reducing equity exposure.
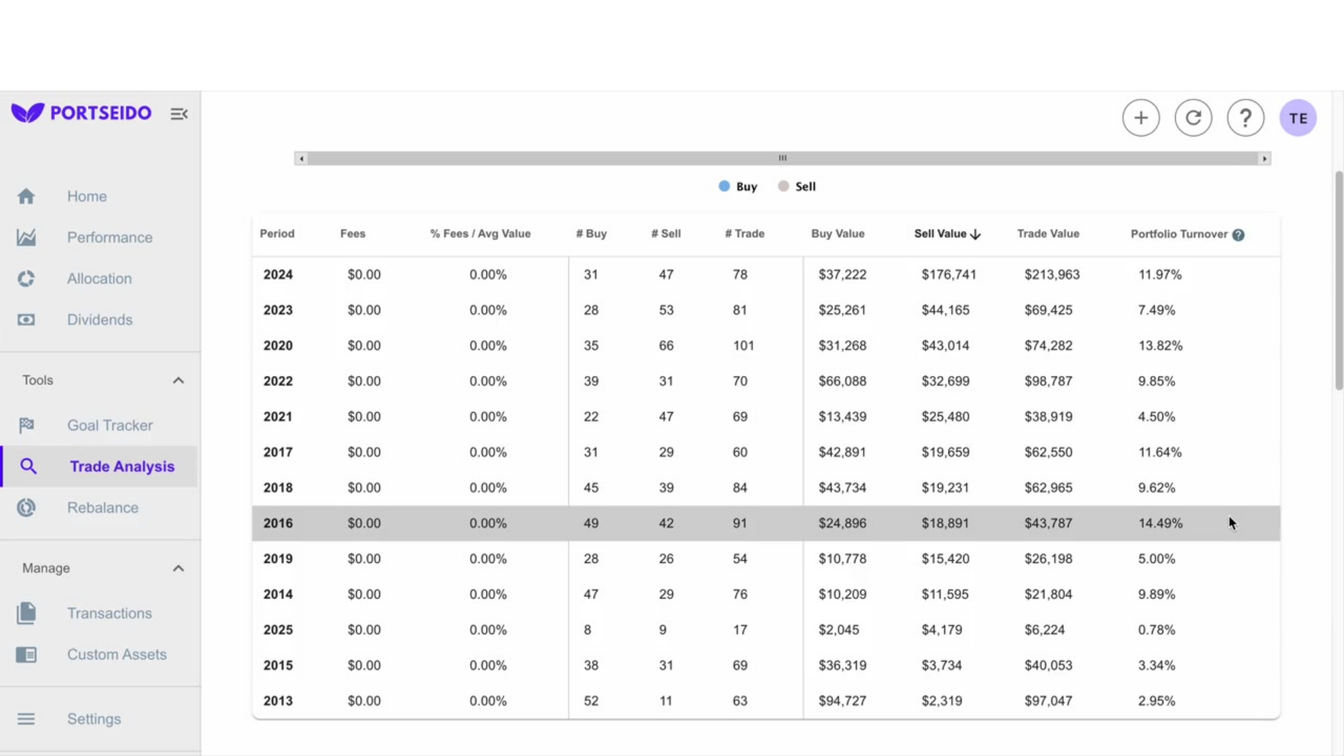
Trade count on its own overstates the activity. Portfolio turnover, which measures the proportion of a portfolio replaced over a year, stayed around 14% at its peak in this data. A 14% turnover implies an average holding period of roughly seven years, so the picture is an investor fine-tuning positions rather than trading them.
Where did Warren Buffett's alpha come from?
The largest single source of excess return in Warren Buffett's tracked portfolio was Apple (AAPL), where one of his earliest 2016 purchases returned +684% against +208% from the S&P 500 over the same holding period.
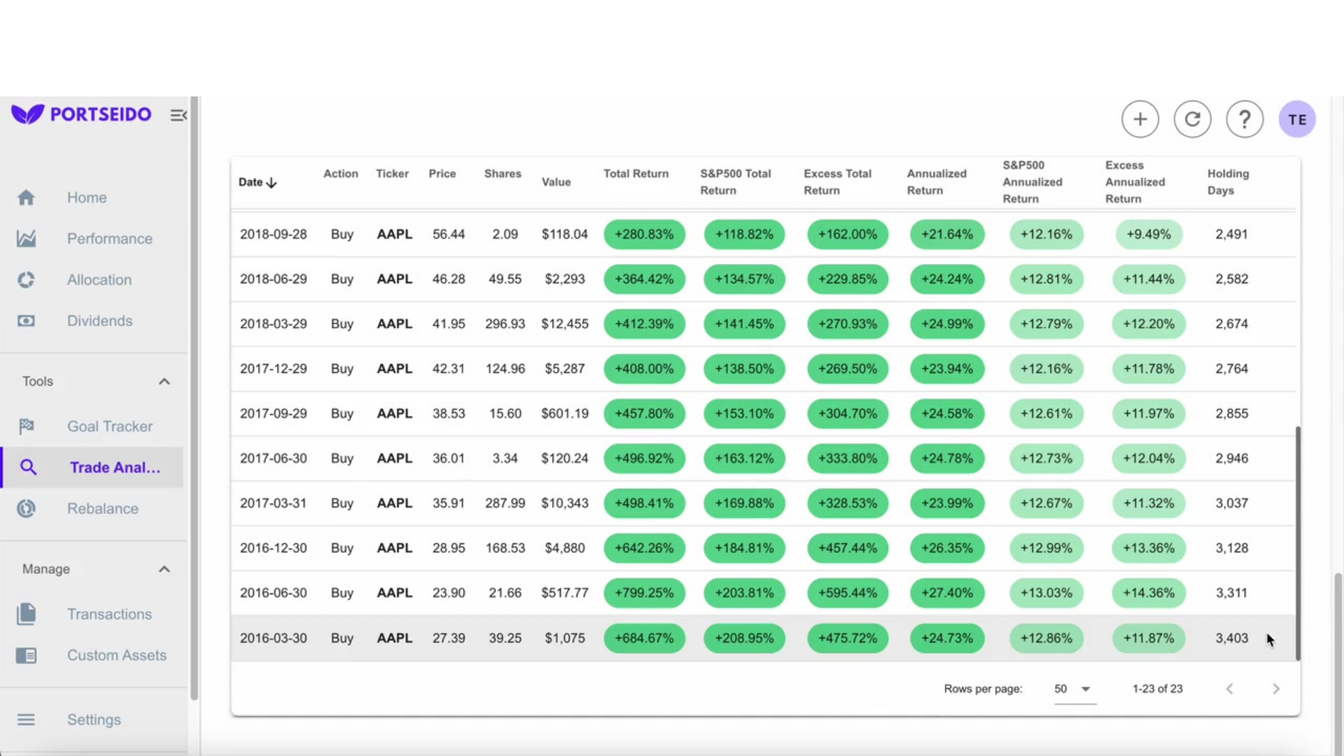
That position is reported with +475% of excess return over the benchmark for the same period, which is alpha: return above what the market delivered over the identical window. It shows that a portfolio can trail the index on a full-period annualised basis while still containing individual decisions that beat it enormously. Concentration is what lets a single position matter that much, and it works in both directions.
What can investors learn from Warren Buffett's portfolio?
Three lessons come out of the 2013-2025 data on Warren Buffett's equity portfolio, and none of them depends on having Berkshire Hathaway's capital.
- Conviction concentrates returns. With the top ten holdings at 87.6% of the portfolio, a single decision such as Apple can move the whole result. The same structure means a single mistake would too.
- Patience is measurable. A -39.14% drawdown that took 451 days to recover is the price of admission, and most investors sell somewhere inside that window.
- "Buy and hold" is not "buy and forget." 101 trades in 2020 and $176 billion sold in 2024 sit alongside a 14% turnover. The positions are held for years and still actively managed.
Frequently asked questions
What is a 13F filing and what does it leave out?
A Form 13F is a quarterly report that US institutional investment managers with over $100 million in qualifying assets must file with the SEC, listing their US-listed equity positions. It is filed within 45 days of quarter end, so it is always backward-looking. A 13F excludes cash, bonds, foreign-listed shares, short positions and wholly-owned businesses, which is why it shows only part of Berkshire Hathaway.
Why does 13F-based analysis estimate trade prices?
A 13F reports the positions held at the end of a quarter, not the individual trades or the prices paid. Any performance analysis built on 13F data therefore has to estimate when a position changed and at what price, conventionally using quarter-end values. That estimation is why 13F-derived returns approximate a manager's results rather than reproduce them exactly.
What does a beta of 1.01 mean for a portfolio?
A beta of 1.01 means a portfolio has historically moved almost exactly in step with its reference market: a 10% market move corresponds to roughly a 10.1% move in the portfolio. Beta says nothing about whether returns were good, only about how closely the portfolio tracked market swings. A concentrated portfolio can still have a beta near 1.
Can an individual investor copy a 13F portfolio?
An individual can buy the same listed stocks a 13F discloses, but not the same portfolio. The filing arrives up to 45 days after quarter end, so the prices have moved; it omits the cash, private businesses and insurance operations that shape Berkshire Hathaway's risk; and it does not disclose the cost basis behind a figure like a 3.25% yield on cost, which came from purchases made years earlier.
Why is yield on cost higher than dividend yield?
Yield on cost divides a holding's current annual dividend by the price originally paid for it, while dividend yield divides the same dividend by today's price. When a share has risen and its dividend has grown, yield on cost rises above dividend yield. The gap measures how long you have held and how much the dividend grew, not how attractive the stock is now.
How to track a concentrated portfolio in Portseido
Portseido is the portfolio tracker used to produce the analysis on this page, and it does the same job on a personal portfolio. It consolidates holdings across multiple brokers and currencies, calculates time-weighted and money-weighted returns, tracks cost basis, records dividend income and yield on cost, benchmarks the portfolio against indices and ETFs, and reports allocation and drawdown so concentration and its cost are both visible.
That combination is what makes a Buffett-style comparison possible on your own holdings: position weights, the drawdown you actually sat through, and the return next to an index over the same period. Portseido tracks and reports on your portfolio; it does not give buy or sell recommendations. There is a free plan, and paid features come with a 14-day trial that does not need a credit card. Try Portseido free