

Portfolio Performance Evaluation - Metrics to Use
Article last updated: September 10, 2026

Portfolio performance evaluation is the process of measuring how well an investment portfolio has done, on both the return it produced and the risk it took to produce it. Without it there is no way to tell whether a strategy is working or whether a good year was simply a rising market. The metrics used for return, for risk, and for the two combined are set out below.
Key takeaways
- Portfolio performance evaluation measures a portfolio on three fronts: how much it returned, how much risk it carried, and how much return it produced per unit of that risk.
- Return metrics include simple return, time-weighted return and money-weighted return, and they give different answers for the same portfolio because each treats deposits and withdrawals differently.
- Risk metrics include the standard deviation of returns, downside risk deviation, beta and maximum drawdown, each defining risk in a different way.
- Risk-adjusted return metrics such as the Sharpe ratio, Treynor ratio and Sortino ratio divide excess return by a measure of risk, so portfolios of different volatility can be compared on one scale.
- Every metric described here is backward-looking, calculated from historical data, so none of them predicts how a portfolio will behave next.
What is portfolio performance evaluation?
Portfolio performance evaluation is the assessment of an investment portfolio's results against its objectives, covering both the return earned and the risk taken to earn it. It is a scoreboard rather than a forecast: it grades decisions already made.
Investing has two sides regardless of strategy, return and risk, so a complete evaluation asks three questions. How much did the portfolio make? How much risk did it carry? Was the return worth the risk? A portfolio judged on return alone looks excellent right up until the risk that produced it arrives.
Why should you evaluate your portfolio's performance?
Evaluating portfolio performance tells you whether your investments are meeting your goals and where the gap is if they are not, which is the only reliable basis for changing anything.
A 10% return sounds good on its own. Set against a benchmark that returned 20% over the same period, it looks like an expensive year. Regular evaluation separates skill from market conditions and shows whether the risk in the portfolio is the risk you intended to take.
Which metrics do you need to evaluate a portfolio?
Portfolio performance evaluation uses three families of metrics: return metrics, risk metrics, and risk-adjusted return metrics that combine the two.
| Metric family | What it answers | Common measures |
|---|---|---|
| Return | How much did the portfolio make? | Simple return, time-weighted return, money-weighted return, alpha |
| Risk | How much uncertainty or loss did it carry? | Standard deviation, downside risk deviation, beta, maximum drawdown |
| Risk-adjusted return | Was the return worth the risk? | Sharpe ratio, Treynor ratio, Sortino ratio |
No single number covers all three, so a useful evaluation quotes at least one metric from each family over the same period.
How do you measure portfolio return?
Portfolio return is measured by expressing the portfolio's gain, including price appreciation and income such as dividends and interest, as a percentage of the capital invested. Three methods are in common use and they differ in how they handle deposits and withdrawals.
Simple return (SR)
Simple return is the total gain on a portfolio divided by the initial investment, with no adjustment for how long the money was invested or when it arrived.

Simple Return = Total Gain / Initial Investment
Total gain includes capital appreciation plus distributions received, such as dividends and interest. Simple return is easy to compute and easy to distort: a deposit made late in the period inflates the denominator without having had time to earn anything, so the reported return falls even though nothing changed.
Time-weighted return (TWR)
Time-weighted return splits the period into sub-periods at every cash flow, calculates each sub-period's return separately, and chains them together so each sub-period counts equally regardless of the balance at the time.
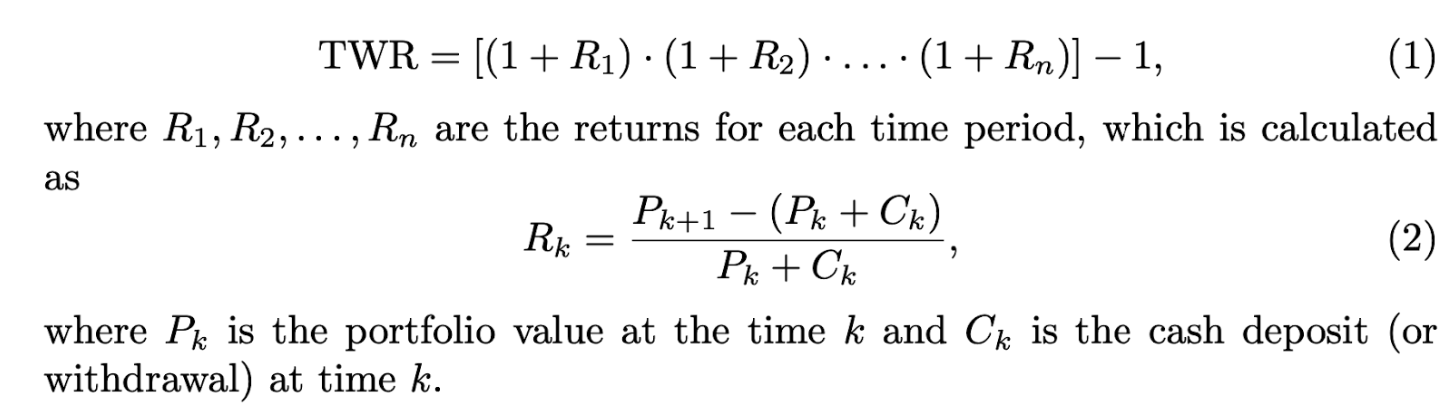
R_k = (P_k+1 - (P_k + C_k)) / (P_k + C_k)

TWR = [(1 + R_1) x (1 + R_2) x ... x (1 + R_n)] - 1
P_k is the portfolio value at time k and C_k is the cash deposited or withdrawn at time k. Because cash flows only set the sub-period boundaries and never enter the returns, time-weighted return measures how the investments performed rather than when money arrived, which is why it is the reporting standard for funds and managers.
Money-weighted return (MWR)
Money-weighted return is the single rate of return that equates the portfolio's starting value to the discounted value of every subsequent cash flow plus the discounted terminal value, so it counts both the size and the timing of contributions.
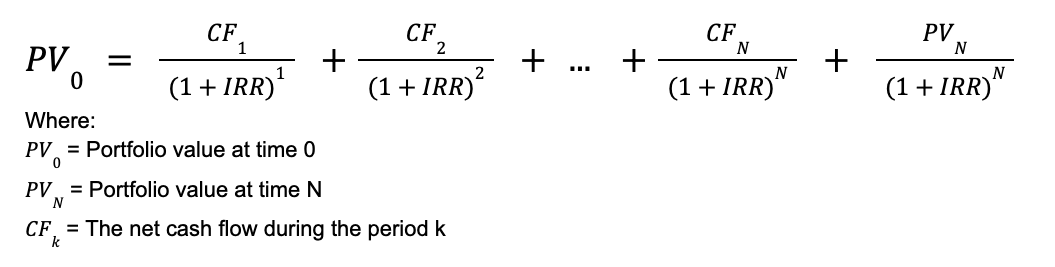
PV_0 = CF_1/(1 + IRR)^1 + CF_2/(1 + IRR)^2 + ... + CF_N/(1 + IRR)^N + PV_N/(1 + IRR)^N
PV_0 is the portfolio value at time 0, PV_N the value at time N, and CF_k the net cash flow during period k. Money-weighted return is identical to the internal rate of return, and because a larger balance carries more weight, a big deposit made just before a decline lowers the figure, as it lowered the investor's outcome.
Keeping these three figures current by hand means revaluing the portfolio at every deposit, withdrawal and dividend date. Portseido calculates simple return, time-weighted return and money-weighted return from your transaction history automatically, across brokers and currencies.
How do you measure excess return with alpha?
Alpha measures the return a portfolio earned above what the risk it took should have produced, using the capital asset pricing model (CAPM) to define what was expected.
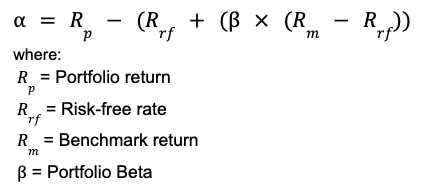
alpha = R_p - (R_rf + (Beta x (R_m - R_rf)))
R_p is the portfolio return, R_rf the risk-free rate, R_m the benchmark return, and Beta the portfolio's sensitivity to that benchmark. A positive alpha means the portfolio beat the return its market exposure predicted; a negative alpha means it fell short. Alpha is only as meaningful as the benchmark chosen for R_m.
How do you measure portfolio risk?
Portfolio risk is measured either as the variability of returns, as sensitivity to the market, or as the depth of actual losses, and the three definitions can disagree about which portfolio is riskier.
Standard deviation of returns
The standard deviation of returns measures how widely a portfolio's periodic returns scatter around their average, and is the most common definition of investment risk.
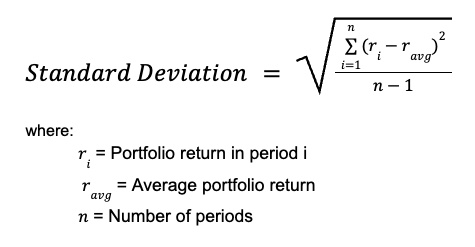
Standard Deviation = sqrt( Sum over i=1..n of (r_i - r_avg)^2 / (n - 1) )
r_i is the portfolio return in period i, r_avg the average portfolio return, and n the number of periods. The rationale is that between two investments with the same average return, the more predictable one is less risky. Stock A returning 9%, 10% and 11% and stock B returning 0%, 10% and 20% both average 10%, but stock B is treated as riskier.
Downside risk deviation
Downside risk deviation measures the variability of only those returns that fall below a target, so unusually good periods are not counted as risk.
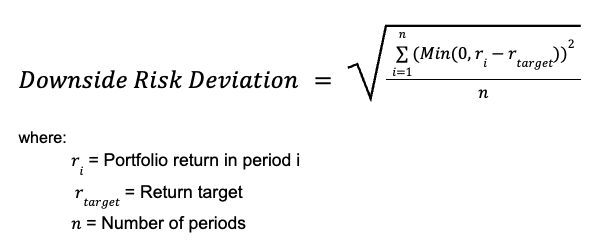
Downside Risk Deviation = sqrt( Sum over i=1..n of (Min(0, r_i - r_target))^2 / n )
r_i is the portfolio return in period i, r_target the minimum acceptable return, and n the number of periods. Standard deviation penalises a large positive month as heavily as a large negative one; downside risk deviation corrects that by keeping only shortfalls against r_target.
Beta
Beta measures how much a portfolio or stock moves relative to the market, so it captures market risk rather than total variability.
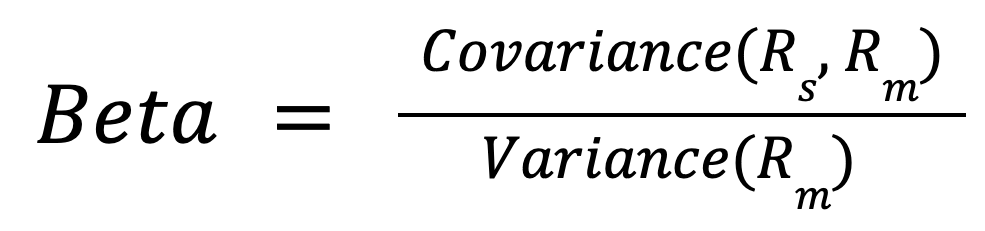
Beta = Covariance(R_s, R_m) / Variance(R_m)
R_s is the return of the stock or portfolio and R_m the return of the market. A beta of 2 means that when the benchmark moves 1%, the investment has historically moved about 2% in the same direction. Beta says nothing about risks unrelated to the market, so a low beta is not automatically safe.
Maximum drawdown
Maximum drawdown is the largest peak-to-trough fall in a portfolio's value over a period, expressed as a percentage of the peak.

Max Drawdown (%) = (Trough Value - Peak Value) / Peak Value
Many investors define risk as the permanent loss of capital, and maximum drawdown is the metric closest to that definition. It also states the loss an investor would have had to sit through without selling.
What are the limits of portfolio risk metrics?
Portfolio risk metrics such as standard deviation, downside risk deviation, beta and maximum drawdown are all backward-looking, so they report the risk a portfolio carried in the past rather than the risk it carries today.
- They lag. A portfolio that has just added leverage is riskier immediately, but its standard deviation, beta and drawdown will not show it for months.
- They depend on the benchmark. Beta and alpha compare a portfolio to a chosen index, and an ill-matched index makes both figures meaningless.
- They miss what is not in the price history. Liquidity risk, concentration and rare severe events leave no trace in past volatility, and a short, calm measurement window makes almost any portfolio look safe.
How do you measure risk-adjusted return?
Risk-adjusted return is measured by dividing a portfolio's return above the risk-free rate by a measure of the risk it took, producing a figure that can be compared across portfolios of different volatility.
Sharpe ratio
The Sharpe ratio divides a portfolio's return above the risk-free rate by the standard deviation of its returns, so it measures excess return per unit of total volatility.
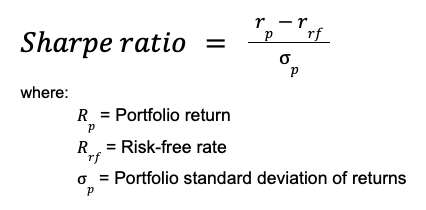
Sharpe Ratio = (r_p - r_rf) / sigma_p
r_p is the portfolio return, r_rf the risk-free rate, and sigma_p the standard deviation of the portfolio's returns. A higher Sharpe ratio means more return per unit of volatility. Because it uses total volatility, it suits a standalone portfolio, which is what its owner actually experiences.
Treynor ratio
The Treynor ratio divides a portfolio's return above the risk-free rate by its beta, so it measures excess return per unit of market risk rather than per unit of total volatility.
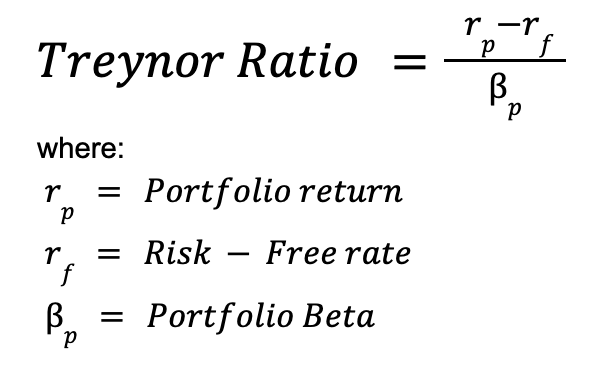
Treynor Ratio = (r_p - r_f) / Beta_p
r_p is the portfolio return, r_f the risk-free rate, and Beta_p the portfolio's beta. The Treynor ratio suits a holding inside an already diversified portfolio, where diversification has removed company-specific risk and market risk is the exposure that remains.
Sortino ratio
The Sortino ratio divides a portfolio's return above the risk-free rate by its downside risk deviation, so upside volatility is not treated as risk.
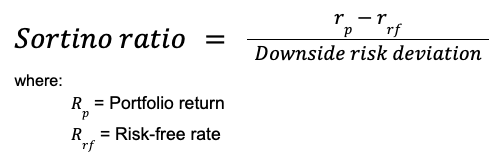
Sortino Ratio = (r_p - r_rf) / Downside Risk Deviation
r_p is the portfolio return and r_rf the risk-free rate, while downside risk deviation counts only returns that fell below a target. The Sortino ratio is the fairer measure for strategies with deliberately lopsided return profiles, where large positive periods would otherwise be scored as risk.
How often should you evaluate portfolio performance?
Review portfolio performance quarterly or annually, and judge results over periods of at least three to five years, because shorter windows report market conditions more than they report decisions.
Checking daily invites reaction to noise, so the practical compromise is to record continuously and evaluate on a schedule. Many investors do the recording in a stock tracking spreadsheet, which works until the number of accounts, currencies and dividend dates makes the maintenance heavier than the insight.
Frequently asked questions
Which single metric best summarises portfolio performance?
No single metric summarises portfolio performance, because return and risk are separate dimensions. The closest to a summary is a risk-adjusted measure such as the Sharpe ratio, which combines both, but it says nothing about drawdown or how the return was earned. A minimum honest report is one return figure, one risk figure and one benchmark comparison.
Do I need a benchmark to evaluate portfolio performance?
Yes, for return and risk-adjusted metrics to mean anything. A 12% return is good or poor only relative to what the same money could have earned elsewhere over the same period. Alpha and beta require a benchmark by definition, and even simple return needs one before you can say whether the result was skill or a rising market.
Should I evaluate individual holdings or just the whole portfolio?
Evaluate both, for different reasons. Portfolio-level metrics tell you whether the strategy is working, while position-level returns and weights tell you where the result came from. A portfolio can beat its benchmark on the strength of one holding, which is useful to know before concluding the approach as a whole is sound.
How to evaluate portfolio performance in Portseido
Portseido is a portfolio tracker that handles the record-keeping side of portfolio performance evaluation. It consolidates holdings across brokers and currencies, calculates simple return, time-weighted return and money-weighted return, tracks cost basis, dividends and yield on cost, and reports asset allocation and drawdown. It also benchmarks a portfolio against indices and ETFs, the comparison that makes any return figure interpretable.
Portseido tracks and reports on your portfolio; it does not calculate every academic risk metric, and it does not give buy or sell recommendations. There is a free plan, and paid features come with a 14-day trial that does not need a credit card. Try Portseido free