

Drawdown definition and what it means to investors
Article last updated: September 10, 2026
Drawdown is one of the most useful metrics for measuring the risk in an investment strategy, because it records what an investor actually lived through rather than a statistical estimate of it. It is also the metric most likely to be misused: watching a drawdown in real time and reacting emotionally to it has ruined more portfolios than the drawdown itself.
Key takeaways
- Drawdown is the decline in an investment's value from its previous peak, expressed as a percentage of that peak.
- Maximum drawdown (MDD) is the largest peak-to-trough decline an investment suffered over a given period, representing the worst outcome for someone who bought at the top and sold at the bottom.
- Drawdown is calculated as the current value minus the peak value, divided by the peak value, which produces a negative percentage.
- Drawdown measures downside risk directly, which is closer to how most investors define risk — the permanent loss of capital — than volatility-based measures such as standard deviation or beta.
- Drawdowns are unavoidable in equity investing, so the useful response is expectation setting rather than reaction.
What is drawdown?
Drawdown is the decline in the value of an investment from its previous peak, typically measured as a percentage. It is used to infer the downside risk of an investment or a strategy.
Many investors consider risk to be the permanent loss of capital, and drawdown is the metric closest to that definition. Where standard deviation and beta describe how widely returns scatter, drawdown describes how far the account actually fell and how long it stayed down.
Drawdown is always negative or zero. An investment sitting at a new all-time high has a drawdown of 0%; one that has fallen from $100,000 to $80,000 has a drawdown of -20%.
What is maximum drawdown?
Maximum drawdown (MDD) is the largest percentage decline in an investment's value from a peak to a subsequent trough over a specific time frame. It measures the single biggest drop the investment suffered during the period.
Maximum drawdown matters because it describes the worst-case experience for an investor who bought at the highest point and sold at the lowest point. It answers a question no average return can: how bad did this get? The metric is particularly relevant during economic downturns, since significant drawdowns often coincide with recessions.
Maximum drawdown is measured over a stated window, and the window changes the answer. A fund's maximum drawdown since inception and over the past three years are different numbers, so always quote the period alongside the figure.
How is maximum drawdown calculated?
Maximum drawdown is calculated by finding the drawdown at every point in the period — the current value minus the running peak value, divided by that peak value — and taking the largest decline among them.
Drawdown formula

Drawdown (%) = (Current Value - Peak Value) / Peak Value

Maximum Drawdown = the most negative Drawdown (%) over the period
The peak value is the highest value the investment reached at any point up to and including the current date, not the highest it ever reached. The running peak only ever goes up, and it resets the reference point each time the investment makes a new high.
Max drawdown calculation example
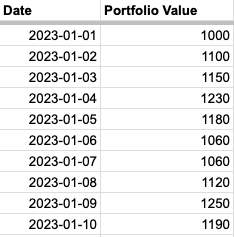
To find the maximum drawdown from a series of portfolio values, identify each peak and the lowest value that followed it, calculate the drawdown for each of those pairs, then take the largest decline. In the series above, the deepest pair is a peak of 1,230 followed by a trough of 1,060:
MaxDrawdown = (1060 - 1230) / 1230 = -13.82%
A maximum drawdown of -13.82% means an investor who bought at the peak of 1,230 and sold at the trough of 1,060 lost 13.82% of the amount invested. It also sets a recovery target: the portfolio needs to gain 16.04% to return to its old peak, because that gain is calculated on the smaller remaining balance.
How do you calculate maximum drawdown in a spreadsheet?
Maximum drawdown is calculated in a spreadsheet in three steps: build a running peak column, calculate the drawdown at each period against that peak, then take the minimum of the drawdown column. Starting from a column of historical portfolio values, one row per period:
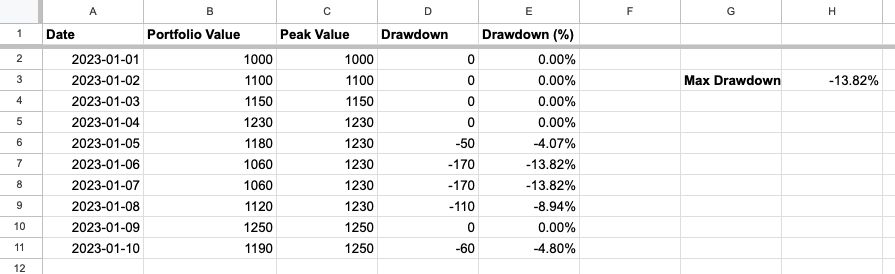
- Calculate the peak value of each period using the "MAX" function, which carries the running high forward:
MAX(Current Value, Previous Peak Value)
- Compute the drawdown (%) at each period against that running peak:
(Current Value - Peak Value) / Peak Value
- Get the maximum drawdown by applying the "MIN" function to the whole drawdown (%) column. MIN rather than MAX, because drawdowns are negative numbers and the largest decline is the most negative one.
The hard part is not the formula but the input column: building an accurate value history means valuing every holding at every date, across every broker and currency, including dividends and deposits. Portseido reports drawdown directly from your transaction history, alongside time-weighted and money-weighted returns, so the value series stays current without spreadsheet maintenance.
Why should investors track drawdown?
Investors should track drawdown because it quantifies the downside their strategy actually produced, which is the risk figure that determines whether they can stick with it. A strategy an investor abandons at the bottom returns nothing, regardless of what its backtest showed.
Drawdown adds something that return figures and volatility measures do not:
- It is expressed in the terms people feel. "Down 42% from the peak" lands differently from "annualised volatility of 18%", and it is the same information about the same risk.
- It reveals strategy risk. A portfolio with a much deeper maximum drawdown than its benchmark is taking more downside risk, whatever its headline return says.
- It is a personal calibration tool. Comparing the drawdown you have tolerated in the past against the one your current allocation implies is a reality check on how your capital is split across asset classes.
The risk is emotional attachment to the number. Watching an investment drop 50% from $100,000 to $50,000 is genuinely painful, and it is easy to guess what an emotional investor does next: panic selling. The most reliable defence is expectation management — knowing in advance what a normal downturn looks like, so the drawdown feels like a known cost rather than an emergency.
What drawdowns should investors expect?
Investors should expect deep drawdowns as a normal feature of equity investing, not as an exception. Drawdowns cannot be avoided, so the only real question is how large a one a given strategy implies.
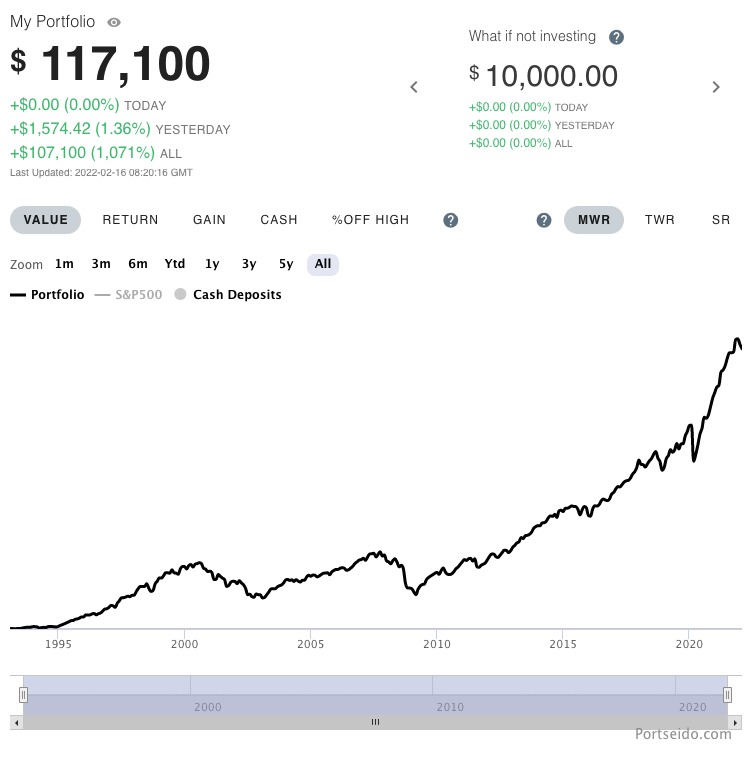
Measured to 15 February 2022, SPY (SPDR S&P 500 ETF Trust) had produced an annualized return of 8.87% over the preceding 29 years. An investment of $10,000 in SPY over that period would have grown to $117,100, a 1071% total return.
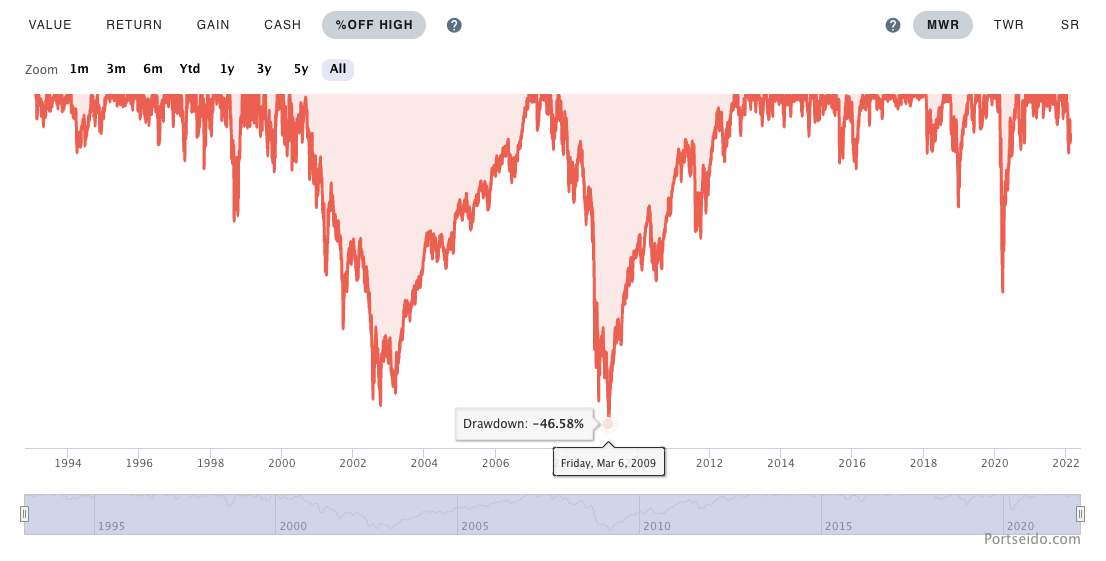
What that headline return does not tell you is what it took to collect. Over the same 29 years, an SPY investor saw the investment halved once, down more than 30% three times, and down more than 10% twelve times. Translated into expectations: an S&P 500 investor should anticipate being down more than 40% roughly once every 15 years, more than 30% about once a decade, and more than 10% about every 2.5 years — while still expecting something like an 8.87% annualized return over the long term.
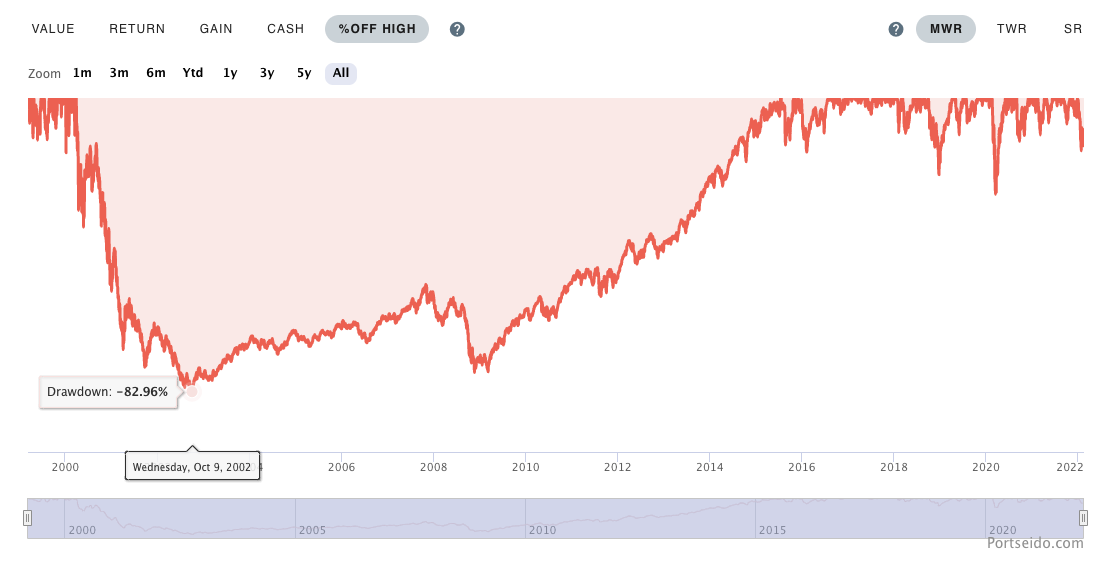
QQQ (Invesco QQQ Trust, which tracks the Nasdaq-100 Index) did considerably worse on drawdown over the same measurement window. Over the preceding 22 years it had returned 12.42% annualized, a total of 1356%, yet it dropped 82.96% in just 2.5 years and took almost 13 years to recover the value that had been wiped out. A higher long-run return came with a far deeper hole in the middle.
The future may not repeat the past, but this history is a reasonable proxy for setting downside expectations. Matching that expectation against your own risk appetite is how you choose a strategy you can hold: an aggressive approach such as growth investing implies both a higher expected return in a bull market and a deeper drawdown in a downturn, while a conservative approach such as value investing implies less of both.
How should investors respond to a drawdown?
Investors should respond to a drawdown by treating it as information rather than as an instruction to act. Drawdown is a proxy for how much risk a strategy carried; it is not a signal that the strategy has failed.
Two principles hold in a drawdown, and they hold in bull markets too.
Act deliberately, not reactively. Every decision should be justified by reasoning about the underlying investments, not by the size of the number on the screen. If nothing about the businesses you own has changed, a falling price is a change in the market's opinion rather than in the facts.
Treat mistakes as material to learn from. Every investor makes them: overleveraged businesses, low-moat companies with unsustainable growth, overly optimistic expectations during a bubble. What separates good investors from the rest is what they do with those mistakes afterwards. Improving a little at a time compounds much like interest does — imperceptible day to day, decisive over a decade.
Reviewing drawdown after the fact, alongside the full set of portfolio performance measures, is far more useful than watching it live.
Frequently asked questions
What is the difference between drawdown and loss?
A loss is realised when an investment is sold below its cost, while drawdown is the decline from a previous peak whether or not anything has been sold. An investment bought at $50 that rose to $100 and fell back to $80 is showing a 20% drawdown and a 60% gain at the same time. Drawdown measures distance from the high, not from what you paid.
How much does an investment need to gain to recover from a drawdown?
More than it lost, because the gain is calculated on the smaller remaining balance. Recovering from a 20% drawdown requires a 25% gain, from a 50% drawdown requires a 100% gain, and from an 80% drawdown requires a 400% gain. The formula is 1 / (1 + drawdown) - 1. This asymmetry is why deep drawdowns matter far more than shallow ones.
Is maximum drawdown better than standard deviation as a risk measure?
Maximum drawdown and standard deviation measure different things and are best read together. Standard deviation describes how widely returns scatter in both directions; maximum drawdown describes the single worst peak-to-trough decline. Drawdown is closer to how investors experience risk, but rests on one historical episode, so it is more sensitive to the period chosen than risk measures such as the Sharpe Ratio.
What is drawdown duration?
Drawdown duration is the time between an investment's peak and the moment it recovers that peak, and it is often more punishing than the depth of the decline. A portfolio down 30% for six months and one down 30% for nine years produce the same maximum drawdown figure but completely different experiences. Quote depth and duration together wherever possible.
Should I sell to avoid a drawdown?
Selling into a drawdown converts a paper decline into a realised loss, and recovering then requires a second correct decision about when to buy back. Historically, deep declines in broad equity indices have been followed by recoveries, though the wait has sometimes run past a decade. The decision should rest on whether your reasons for owning the investments still hold, not on the size of the decline.
How to track drawdown in Portseido
Portseido is a portfolio tracker that reports drawdown for your actual portfolio rather than for an index. It consolidates holdings across brokers and currencies, builds the portfolio value history that drawdown is calculated from, and shows drawdown alongside time-weighted and money-weighted returns, cost basis, dividends, yield on cost and asset allocation. You can also benchmark the portfolio against indices and ETFs to see whether your drawdown was deeper or shallower than the market's.
It suits self-directed investors who want one consistent record of what their strategy actually put them through. Portseido tracks and reports on your portfolio; it does not give buy or sell recommendations, and it will not tell you when a drawdown is over. There is a free plan, and paid features come with a 14-day trial that does not need a credit card. Try Portseido free