

What is Beta and what does it mean for investors?
Article last updated: September 10, 2026
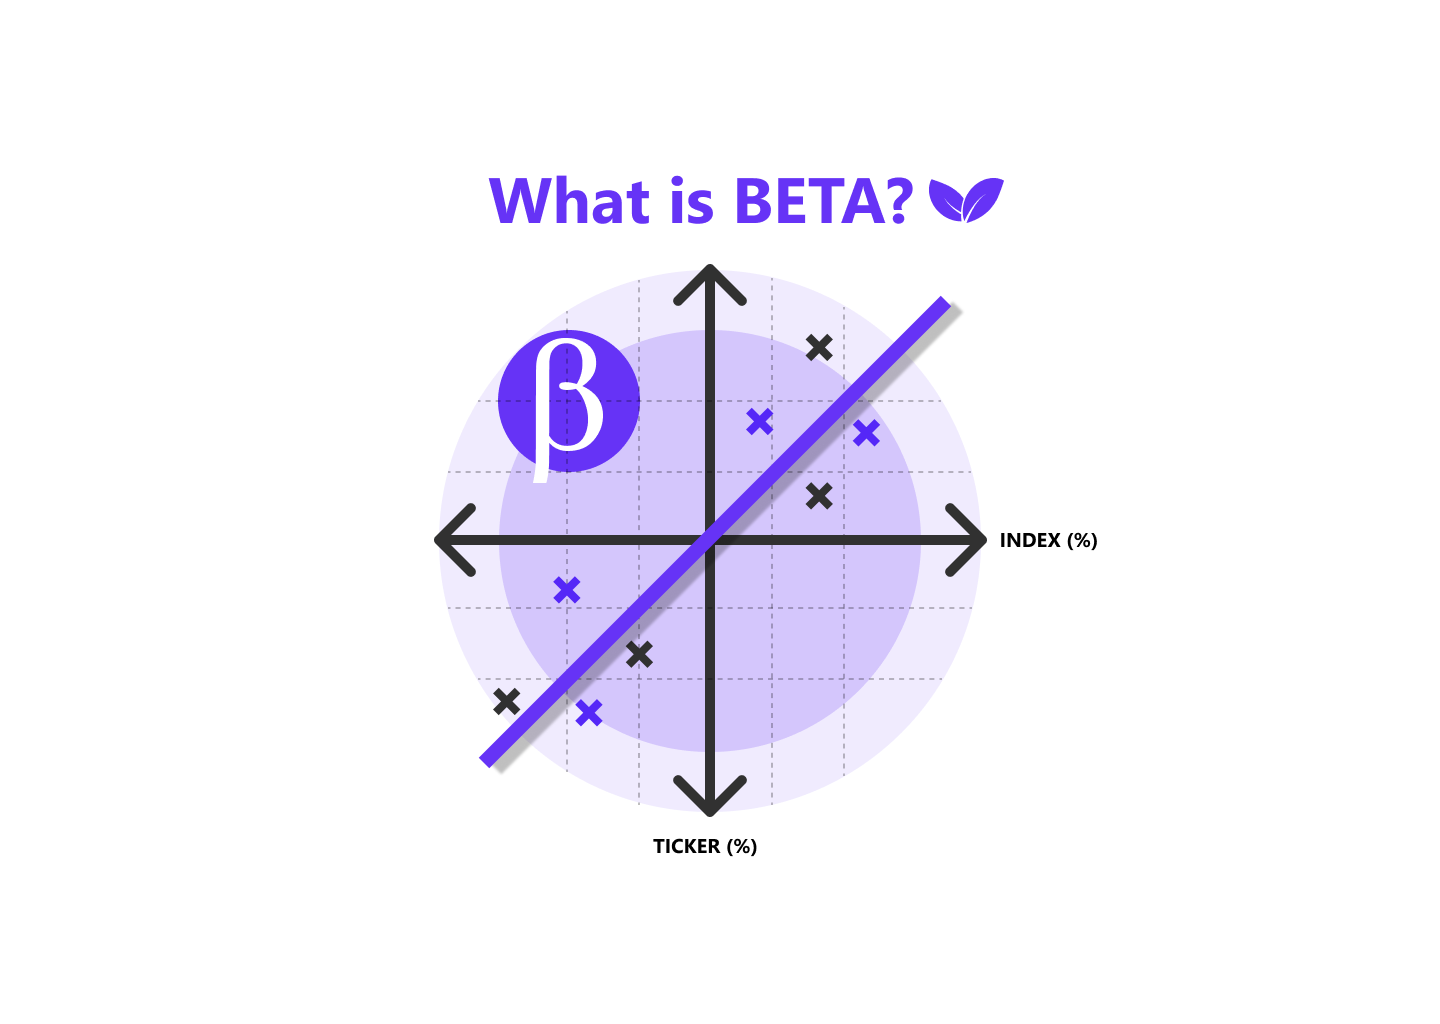
Beta (β) measures how volatile a stock or portfolio is relative to its benchmark. It was introduced as the risk term in the Capital Asset Pricing Model (CAPM), where it converts market risk into an expected return, and it has since become one of the most widely quoted risk figures on a stock page.
Key takeaways
- Beta measures how much an asset's or portfolio's return moves relative to the return of its benchmark, with 1.0 meaning it moves in line with the market.
- Beta is calculated as the covariance between the asset's returns and the market's returns, divided by the variance of the market's returns.
- A beta above 1.0 amplifies market moves in both directions, a beta below 1.0 dampens them, and a negative beta means the asset tends to move opposite to the market.
- Beta is the risk input in the Capital Asset Pricing Model, where expected return equals the risk-free rate plus beta times the market risk premium.
- Beta is estimated from historical returns and defines risk as volatility, so it can misjudge an asset whose volatility is mostly to the upside.
What is beta in investing?
Beta is a measure of an investment's return sensitivity relative to a benchmark, expressed as a multiplier. A beta of 1.0 means the investment has historically moved roughly one-for-one with the market; a beta of 2.0 means it has moved about twice as much in the same direction.
Beta captures only market risk, the risk that affects every asset at once and that cannot be diversified away. It says nothing about company-specific risk, which diversification across enough holdings largely removes. This is why beta appears in portfolio theory as the residual risk an investor is left holding after diversification has done its work.
Beta is always measured against something. A stock's beta against the S&P 500 and its beta against a sector index are different numbers, and neither is more correct than the other — they answer different questions.
How is beta calculated?
Beta is calculated by dividing the covariance between the asset's returns and the benchmark's returns by the variance of the benchmark's returns.
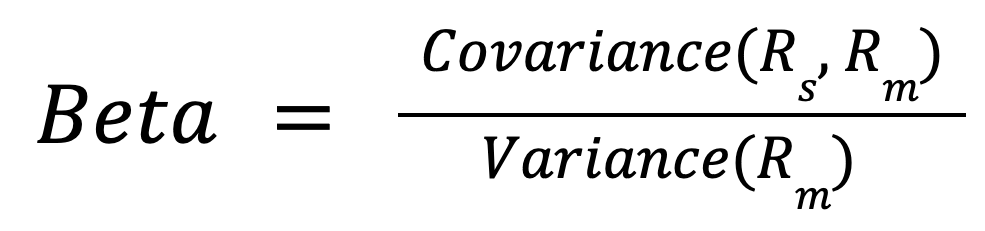
Beta = Covariance(R_s, R_m) / Variance(R_m)
Where R_s is the return of the asset or portfolio and R_m is the return of the benchmark or market. Covariance is a statistical measure of how much two sets of data tend to move together; variance measures how widely one set of data scatters around its own average.
In practice beta is estimated from historical data by regressing the asset's returns against the benchmark's returns over a chosen window, commonly monthly returns over three to five years. Because it is fitted to a sample, beta changes as the window moves and as the relationship between the asset and the market shifts.
Beta calculation example
If a stock's monthly returns have a covariance of 0.0024 with its benchmark's monthly returns, and the benchmark's monthly returns have a variance of 0.0016, the stock's beta is 1.5.
Beta = 0.0024 / 0.0016 = 1.5
A beta of 1.5 means that when the benchmark moved 1%, this stock historically moved about 1.5% in the same direction, on average. If the benchmark fell 10% over a month, a 1.5-beta stock would be expected to fall roughly 15%.
How does the Capital Asset Pricing Model use beta?
The Capital Asset Pricing Model uses beta to scale the market risk premium into the extra return an investor should expect from a specific investment. CAPM assumes a linear relationship between risk and return: the more market risk an asset carries, the higher the return it should be expected to deliver.
Expected Return = Risk-free Rate + Risk Premium
Expected Return = Risk-free Rate + [Beta x Market Risk Premium]
Expected Return = Risk-free Rate + [Beta x (Market Return - Risk-free Rate)]
The risk-free rate is the return on an asset assumed to carry no risk, usually proxied by a short-term government bond in the same currency. The market risk premium is the extra return an investor should expect for holding the market instead of that risk-free asset. Beta scales that premium: an investment twice as risky as the market should command twice the market risk premium.
For example, with a risk-free rate of 2%, a market return of 8% and a beta of 1.5, CAPM expects a return of 2% + 1.5 x (8% - 2%) = 11%. That expected return is also the bar used to calculate alpha, the return an investment earned above what its risk predicted.
What does a beta of 1, above 1 or below 1 mean?
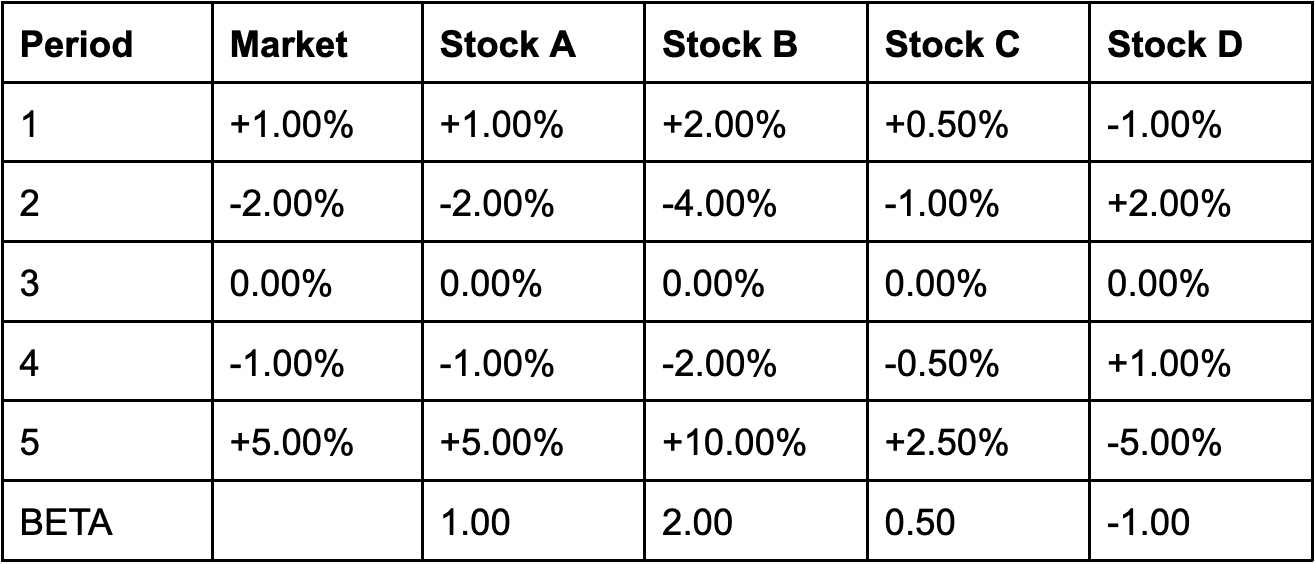
A beta of 1.0 means the investment moves in line with its benchmark, a beta above 1.0 means it amplifies the benchmark's moves, and a beta below 1.0 means it dampens them. Beta can take any value, including negative ones.
| Beta | Behaviour relative to the benchmark | Typical example |
|---|---|---|
| Above 1 (e.g. 2.0) | Moves in the same direction but by more. If the benchmark rises 1% in a period, the stock rises about 2%. | High-growth stocks |
| Equal to 1 | Moves roughly in line with the benchmark. | A broad market index fund |
| Between 0 and 1 (e.g. 0.5) | Moves in the same direction but by less. If the benchmark rises 1% in a period, the stock rises about 0.5%. | Utility stocks |
| Below 0 | Tends to move in the opposite direction to the benchmark. | Some hedges and inverse strategies |
Note that beta is symmetric. A stock with a beta of 2.0 is expected to fall about twice as far as the benchmark in a down period, not only to rise twice as far in an up one. That symmetry is exactly why beta is treated as a risk measure rather than a return measure.
What is a good beta?
A good beta is one that matches what you want the holding to do: around 1.0 to track the market, above 1.0 to accept deeper declines in exchange for amplified gains, below 1.0 to prioritise stability of value. There is no beta that is right for every investor, because beta describes exposure rather than quality.
Three practical uses of beta:
- Setting expectations for declines. A portfolio beta of 1.3 implies that a 20% market fall would translate into roughly a 26% portfolio fall, which is worth knowing before it happens rather than after.
- Understanding what you actually own. A portfolio of 30 stocks that all have betas above 1.5 is not as diversified as the stock count suggests.
- Interpreting risk-adjusted returns. Beta is the denominator of the Treynor Ratio, which measures excess return per unit of market risk.
Reading beta alongside the actual drawdown a portfolio suffered gives a fuller picture than either number alone, because drawdown records the real peak-to-trough loss rather than a statistical estimate of it. Portseido reports drawdown and benchmarks your portfolio against indices and ETFs from your own transaction history, so you can see how your holdings actually behaved against the market you are comparing them with.
What are the limitations of beta?
The two main limitations of beta are that it is estimated from historical data that may not describe the future, and that it defines risk as volatility rather than as the chance of permanently losing capital.
Beta is backward-looking. Beta is fitted to past returns, so it can misstate current risk whenever the underlying business changes. A company that shifts to financing operations with far more debt will probably see its future return volatility rise, but a beta estimated from the pre-debt period will not show it.
Volatility is not the same as risk. Beta treats every deviation from the benchmark as risk, including upside deviation.
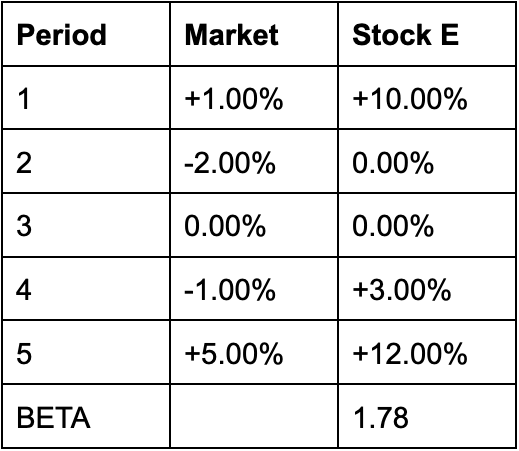
In the example above, Stock E outperformed the market in every period and never posted a negative return, yet it carries a beta of 1.78. By beta's definition it is far riskier than the market, because its returns swung more widely. By the definition most investors actually hold — the risk of losing money permanently — it was not risky at all. Beta alone cannot tell those two cases apart.
Beta depends on the benchmark and the window. The same stock will show different betas against different indices, and different betas over three years than over five. Any beta figure is only interpretable if you know what it was measured against and over what period.
Beta remains useful despite this. It is a compact description of how an investment has behaved relative to its market, which helps characterise a portfolio even when it fails as a forecast.
Frequently asked questions
Can beta be negative?
Yes. A negative beta means the asset has historically moved in the opposite direction to its benchmark, so it tends to rise when the market falls. Gold, certain hedging instruments and inverse funds sometimes show negative betas over particular periods. Negative beta assets can reduce portfolio volatility, but they also drag on returns when the market rises.
What is the beta of a portfolio?
A portfolio's beta is the weighted average of the betas of its holdings, using each holding's share of the portfolio value as its weight. A portfolio that is 60% in a 1.4-beta stock and 40% in a 0.6-beta stock has a beta of (0.6 x 1.4) + (0.4 x 0.6) = 1.08. Cash has a beta of zero, so holding cash lowers portfolio beta directly.
Does a high beta mean higher returns?
Not reliably. The Capital Asset Pricing Model predicts that higher beta should be rewarded with higher expected return, but that is a long-run expectation, not a guarantee for any period. A high-beta stock will amplify a falling market just as it amplifies a rising one, so higher beta buys a wider range of outcomes rather than a better one.
What time period is beta usually measured over?
Beta is most commonly estimated from monthly returns over three to five years, though data providers differ, and some use weekly returns over shorter windows. Two published betas for the same stock can differ noticeably purely because of this choice. Always check the period and frequency before comparing beta figures from different sources.
Is beta the same as volatility?
No. Volatility, usually measured as standard deviation, describes how much an asset's returns scatter on their own. Beta describes only the portion of that movement explained by the benchmark. A stock can be highly volatile and still have a low beta if its swings are driven by company-specific news rather than market moves.
How to track portfolio risk against a benchmark in Portseido
Portseido is a portfolio tracker that shows how your holdings have actually behaved against the market. It consolidates positions across brokers and currencies, calculates time-weighted and money-weighted returns, tracks cost basis, dividends and yield on cost, reports allocation and drawdown, and benchmarks the portfolio against indices and ETFs so you can compare your results with the index your beta would be measured against.
Portseido does not calculate beta or run regressions. It tracks and reports on your portfolio; it does not give buy or sell recommendations. There is a free plan, and paid features come with a 14-day trial that does not need a credit card. Try Portseido free