

Investment Portfolio Benchmarking
Article last updated: September 10, 2026
Benchmarking a portfolio means comparing its results against a reference index or portfolio that represents what the same money could reasonably have earned elsewhere. A return figure on its own is not a verdict: 10% is an excellent year against a market that fell and a poor one against a market that gained 20%. Benchmarking supplies the missing half of the sentence.
Key takeaways
- A benchmark is a reference set of assets, usually a broad market index or ETF, used to judge whether a portfolio's performance was good relative to the alternative.
- Portfolio benchmarking measures opportunity cost, the return you gave up by investing in your own selections rather than in a comparable set of assets.
- A benchmark should have a similar risk and return profile to the portfolio, because comparing against an index of a different risk level explains nothing about skill.
- Benchmarking a portfolio properly compares three things: return, risk, and risk-adjusted return, since beating a benchmark by taking more risk is a different result from beating it outright.
- Use time-weighted return when comparing a portfolio against an index, because an index has no deposits or withdrawals to distort it.
What is a benchmark in investing?
In investing, a benchmark is a set of reference assets or portfolios used to assess and compare the performance of an investment. A broad market index of an asset category is normally chosen, because it represents a comprehensive cross-section of the relevant assets.
The benchmark supplies a standard against which performance can be measured. It answers the question a return figure alone cannot: compared with what? Indices are used for this because they are transparent, investable through funds, and continuously priced, so the comparison is available at any date.
Why is portfolio benchmarking important?
Portfolio benchmarking matters because it measures opportunity cost, the benefit you forgo by choosing one investment over the next best alternative. In investing, that forgone benefit is the true cost of a decision.
Comparing every decision against the best available alternative at the time would be impossible in practice, which is why professional investors settle on an index as a standing proxy for the next best alternative. A stock portfolio returning 10% looks respectable in isolation. Set against a benchmark that returned 20% over the same period, it becomes an expensive year, and the 10-point gap is the number worth investigating.
Benchmarking over several periods also turns performance into feedback. Persistent gaps point to where a strategy is losing ground, and persistent outperformance is at least evidence that the approach is doing something the market is not.
How do you choose the right benchmark for your portfolio?
Choose a benchmark with a similar risk and return profile to your portfolio, most simply by matching the asset classes you actually hold.
Matching matters because the comparison is meant to isolate the value you added by managing the capital yourself. Comparing a conservative bond-heavy portfolio with an aggressive equity index tells you about the risk difference, not about your decisions. Practical guidelines:
- Match the asset class. Equities to an equity index, bonds to a bond index, and a mixed portfolio to a blend of both in the same proportions.
- Match the geography and market segment. A portfolio of US large caps belongs against a US large-cap index, not a global one.
- Match the style where it is pronounced. A portfolio of technology growth companies is better judged against a growth index than a broad market one.
- Fix the benchmark in advance. Choosing a benchmark after the fact, from among the ones you happened to beat, defeats the purpose.
Asset classes can be narrowed as far as a specific industry within a single country if that is genuinely what the portfolio holds.
What are common portfolio benchmarks?
The most commonly used portfolio benchmarks are broad market indices such as the S&P 500, the Nasdaq Composite and the MSCI World Index, along with ETFs that track a specific market segment.
| Benchmark | What it covers | Weighting |
|---|---|---|
| S&P 500 | 500 leading publicly traded companies in the US | Market capitalisation |
| Nasdaq Composite | 3,000+ common equities listed on the Nasdaq exchange, with a high concentration of technology companies | Market capitalisation |
| NYSE Composite | 2,400+ common stocks listed on the New York Stock Exchange | Free-float adjusted market capitalisation |
| Dow Jones Industrial Average (DJIA) | 30 large, well-established companies listed on the NYSE and Nasdaq | Share price |
| MSCI World Index | 1,500+ large and mid cap companies across 23 developed countries | Free-float adjusted market capitalisation |
| QQQ | ETF tracking the 100 largest non-financial companies listed on the Nasdaq, treated as a large cap growth proxy | Market capitalisation |
| EEM | ETF tracking MSCI Emerging Markets, covering large and mid cap companies across 25 emerging markets | Free-float adjusted market capitalisation |
Beyond these, many ETFs specialise in a single industry or market segment, and one of them may fit a concentrated portfolio better than a broad index. You can search for candidates on an ETF screener.
How do you benchmark a portfolio's performance?
Benchmark a portfolio by comparing it with its chosen reference index on three fronts over the same period: return, risk, and risk-adjusted return.
Compare returns
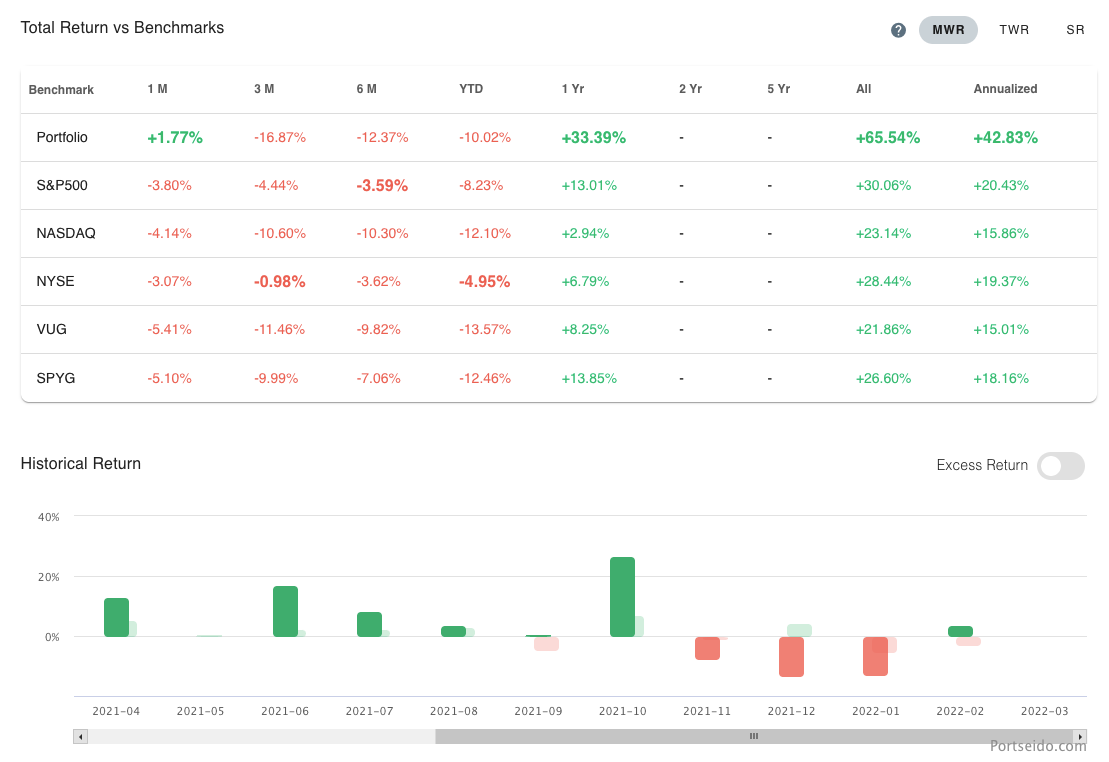
Return is the most common basis for benchmarking, and the comparison is simply the portfolio's return minus the benchmark's return over an identical period.
Excess Return = Portfolio Return - Benchmark Return
A portfolio that returned 10% while its benchmark returned 20% has an excess return of -10 percentage points, which is a meaningful shortfall however good the 10% looked alone. Use the same return method on both sides. Because an index has no deposits or withdrawals, the fair comparison is time-weighted return, which strips cash flows out of the portfolio's figure too, and the four ways to calculate portfolio return set out how each method handles them.
Compare risk
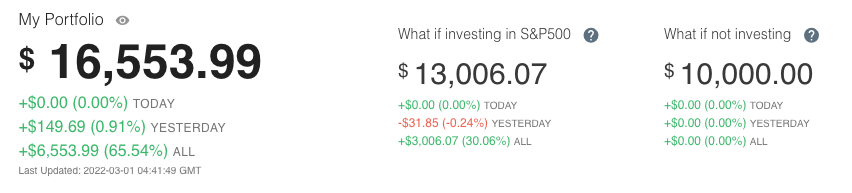
Comparing risk against the benchmark shows whether an outperformance was earned or simply bought with extra risk, for example through leverage or concentration.
Beating a benchmark by 5 points while carrying twice its volatility is a different result from beating it by 5 points with the same volatility. There is nothing wrong with taking more risk deliberately, but the portfolio's owner should be able to see which of the two happened. The usual measures are maximum drawdown, the standard deviation of returns, and beta, which measures how much the portfolio moves relative to the benchmark itself.
Compare risk-adjusted return
Risk-adjusted return expresses how much return a portfolio produced per unit of the risk it carried, folding return and risk into one figure that can be set directly against the benchmark's.
Since investors may knowingly accept more risk in pursuit of higher returns, judging a portfolio against a benchmark on return and risk as separate numbers can be inconclusive. Risk-adjusted measures resolve that by putting both on one scale. The common ones are the Sharpe ratio, which divides excess return by total volatility, and the Treynor ratio, which divides it by beta. Compute the same ratio for the benchmark and compare the two directly.
Doing this by hand means maintaining index price history alongside your own transactions and revaluing both on the same dates. Portseido benchmarks a portfolio against indices and ETFs automatically, using the same time-weighted return it calculates from your transaction history, so the two sides of the comparison stay consistent.
What mistakes should you avoid when benchmarking a portfolio?
The most common benchmarking mistake is comparing a portfolio against an index that does not resemble it, which produces a difference driven by risk rather than by decisions.
- Changing the benchmark after the fact. Picking the index you beat turns the exercise into self-congratulation.
- Comparing different periods. Both figures must cover exactly the same start and end dates.
- Ignoring dividends on one side. A price-only index return compared against a portfolio return that includes dividends flatters the portfolio.
- Judging on one short window. A single quarter reports market conditions; several years report the strategy.
- Comparing return without risk. A portfolio that beat its index with far greater volatility has not necessarily done better.
Frequently asked questions
Should I benchmark against a price index or a total return index?
Benchmark against a total return version of the index, which reinvests dividends, whenever your own return figure includes the dividends you received. Comparing a dividend-inclusive portfolio return against a price-only index return overstates your performance by roughly the index's dividend yield each year, which compounds into a large gap over a decade.
Can I use more than one benchmark?
Yes, and it is often clearer than forcing one. Many investors quote a broad market index for context plus a closer match for the portfolio's actual composition, such as a sector or regional ETF. What matters is choosing all of them in advance and reporting each consistently, rather than switching between them depending on which looks favourable.
How long a period do I need before a benchmark comparison is meaningful?
Compare over at least three to five years, and preferably across both a rising and a falling market. Over a single quarter or year, the gap between a portfolio and its benchmark is dominated by luck and by short-term style rotation. Longer periods that include a downturn reveal whether outperformance survives the conditions that test it.
What benchmark should I use for a portfolio spread across several asset classes?
Use a blended benchmark that mirrors your target allocation, for example 60% of an equity index and 40% of a bond index for a 60/40 portfolio. Blending keeps the risk profiles comparable. Rebalance the benchmark weights on the same schedule you rebalance the portfolio, or the comparison will drift over time.
How to benchmark your portfolio in Portseido
Portseido is a portfolio tracker that benchmarks your portfolio against indices and ETFs, so you can see your performance and the alternative on the same chart. It consolidates holdings across brokers and currencies, calculates time-weighted and money-weighted returns, tracks cost basis, dividends and yield on cost, and reports asset allocation and drawdown, which is the risk side of the comparison. Transactions import from brokers or from a CSV.
It suits self-directed investors who want to know whether their selections are adding anything over a simple index. Portseido tracks and reports on your portfolio; it does not give buy or sell recommendations. There is a free plan, and paid features come with a 14-day trial that does not need a credit card. Try Portseido free