

Nancy Pelosi Stock Portfolio Performance 2024
Article last updated: February 25, 2024
Nancy Pelosi's stock transactions are public for one reason: the STOCK Act requires members of the United States Congress to disclose securities trades made by themselves, their spouses and their dependent children. This article explains that disclosure mechanism, walks through what a portfolio reconstructed from those filings looked like in the February 2024 analysis below, and is explicit about the limits of what public filings can actually tell you.
Key takeaways
- Nancy Pelosi's stock trades are public because the STOCK Act of 2012 requires members of Congress to file a periodic transaction report for securities trades, covering the member, their spouse and their dependent children.
- Congressional periodic transaction reports disclose the ticker, the transaction date and a broad dollar range, but never the exact amount, so any portfolio reconstructed from them is an estimate.
- A portfolio reconstructed from Nancy Pelosi's public filings showed a total return of 50.89% for the year to February 2024, against 26.83% for the S&P 500, 38% for the Nasdaq and 13% for the NYSE in the same analysis.
- The reconstructed portfolio was roughly 90% allocated to technology stocks in that February 2024 analysis, which is the main explanation for both its return and its risk profile.
- Congressional disclosures are filed up to 45 days after a trade, so they are a historical record rather than a signal that can be acted on at the same prices.
How are congressional stock trades disclosed?
Congressional stock trades are disclosed under the Stop Trading on Congressional Knowledge Act of 2012, known as the STOCK Act, which requires members of Congress to file a periodic transaction report for covered securities transactions no later than 45 days after the trade.
The mechanism has a few features that matter for anyone reading the filings:
- Who is covered. A periodic transaction report covers transactions by the member, their spouse and their dependent children. A filing under a member's name therefore does not indicate who made the decision.
- What must be reported. Purchases, sales and exchanges of stocks, bonds, options and other covered securities above a $1,000 threshold.
- How amounts appear. Values are reported in ranges, such as $1,001 to $15,000 or $250,001 to $500,000, rather than as exact figures.
- Where they are published. For House members, filings are published by the Clerk of the House on the public disclosure website, as scanned or generated PDFs.
The reports are a transparency requirement. They record that a transaction occurred and roughly how large it was; they do not establish anything about why it occurred, and this article makes no claim on that question.

Nancy Patricia Pelosi, born 26 March 1940, served in the United States House of Representatives and was the first woman to serve as Speaker of the House and the first woman to lead a major US political party. Her filings attract attention largely because of that public profile, not because the disclosure requirement applies differently to her than to any other member.
What did Nancy Pelosi's disclosed portfolio return?
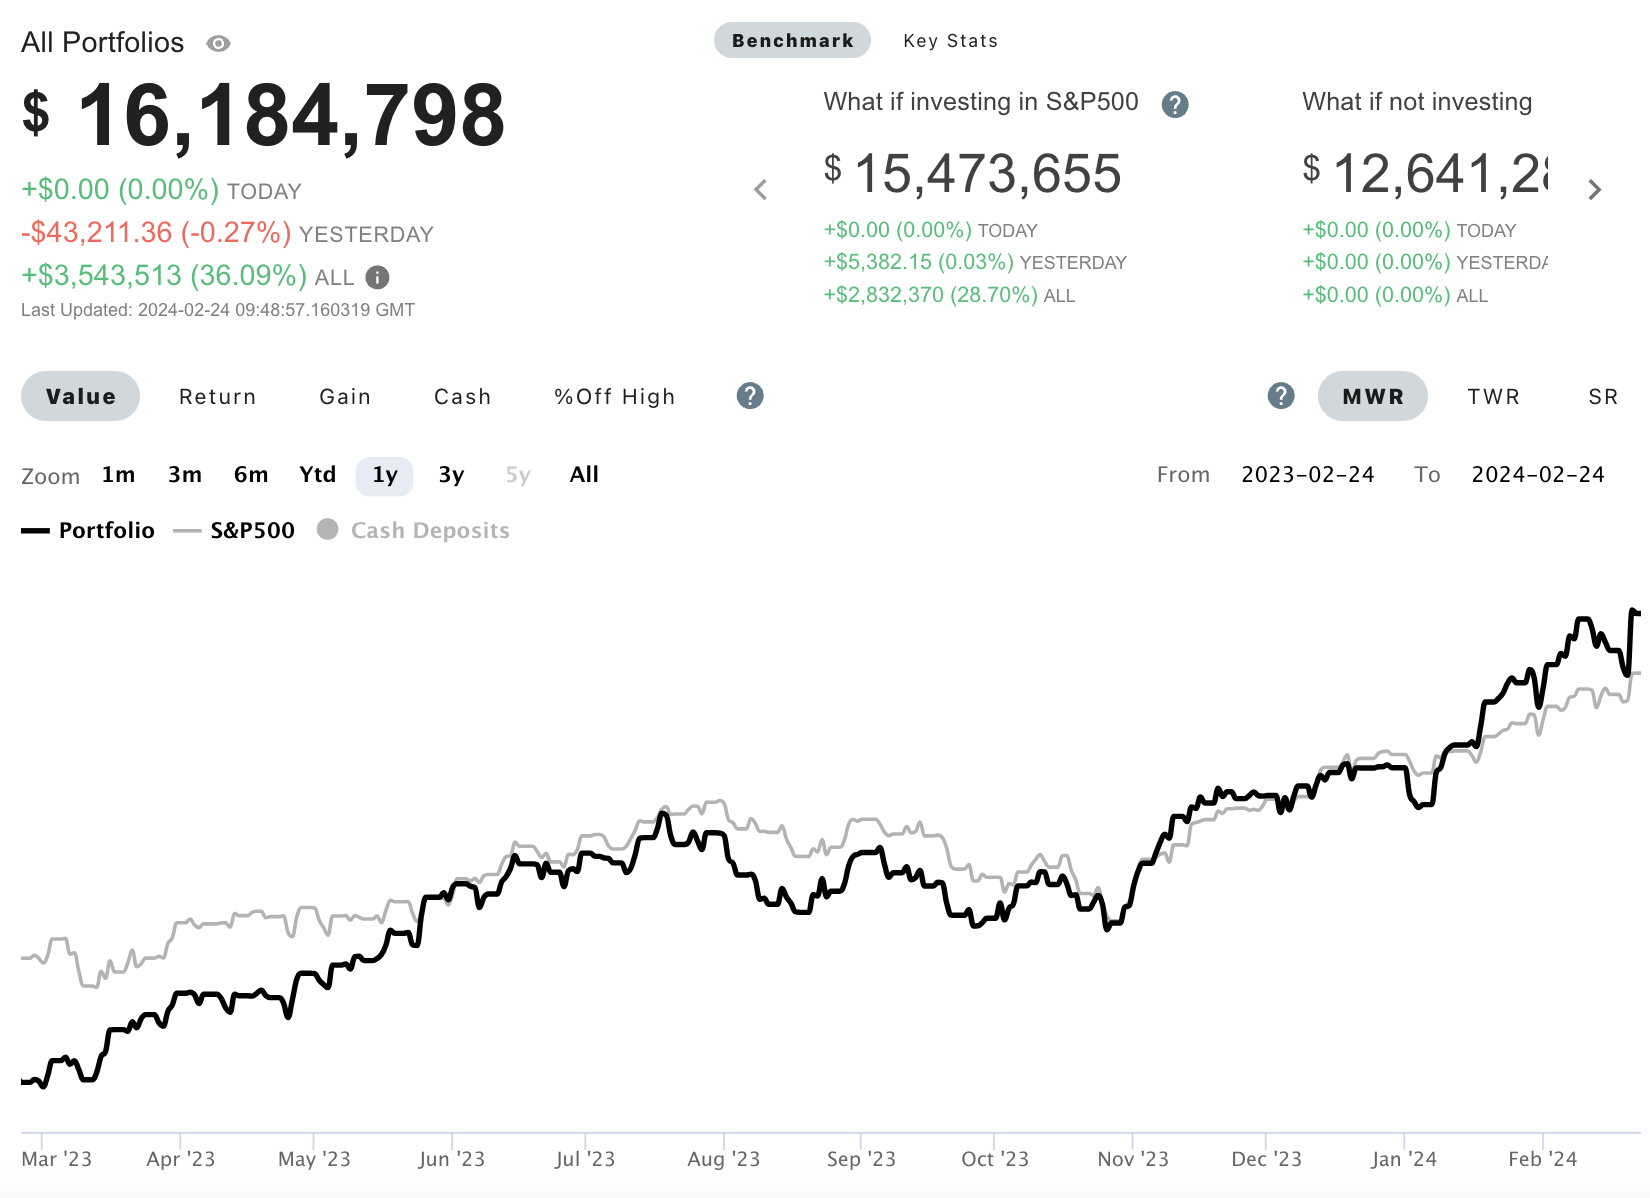
A portfolio reconstructed from Nancy Pelosi's public filings returned 50.89% over the year to February 2024 in the analysis below, compared with 26.83% for the S&P 500, 38% for the Nasdaq and 13% for the NYSE over the same period.
Separately, the New York Post reported in January 2024 that her portfolio had gained 65% over the prior year, against a 24% return for the S&P 500. The two figures come from different reconstructions with different start dates and assumptions, which is itself a useful illustration: any number derived from range-based disclosures depends heavily on how the gaps are filled.
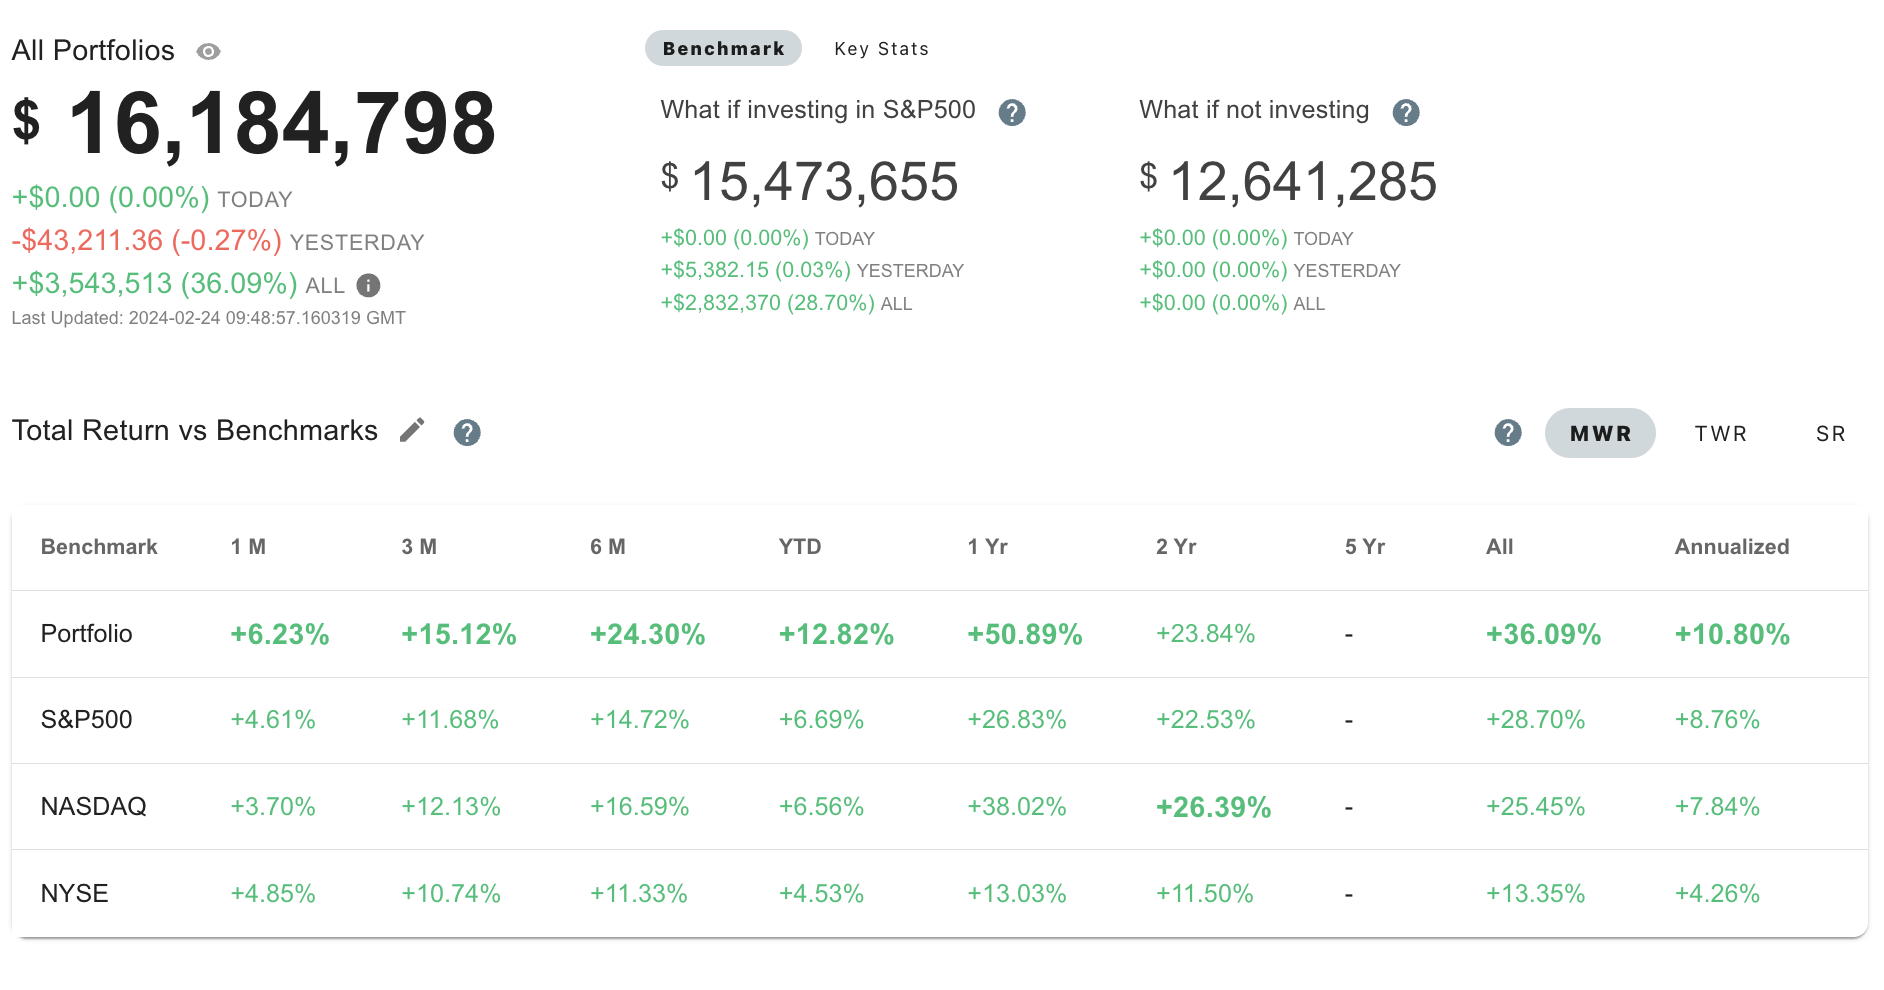
Comparing any portfolio against several indices at once, as above, is more informative than picking one. A technology-heavy portfolio measured against the NYSE will look far stronger than the same portfolio measured against the Nasdaq, which is why choosing a benchmark that matches what you actually hold is the first decision in any performance comparison.
How was this portfolio reconstructed from public filings?
This analysis was built by taking Nancy Pelosi's disclosed transactions from official filings published by the United States House of Representatives, starting from the 2021 data, and entering them into Portseido as a hypothetical portfolio.
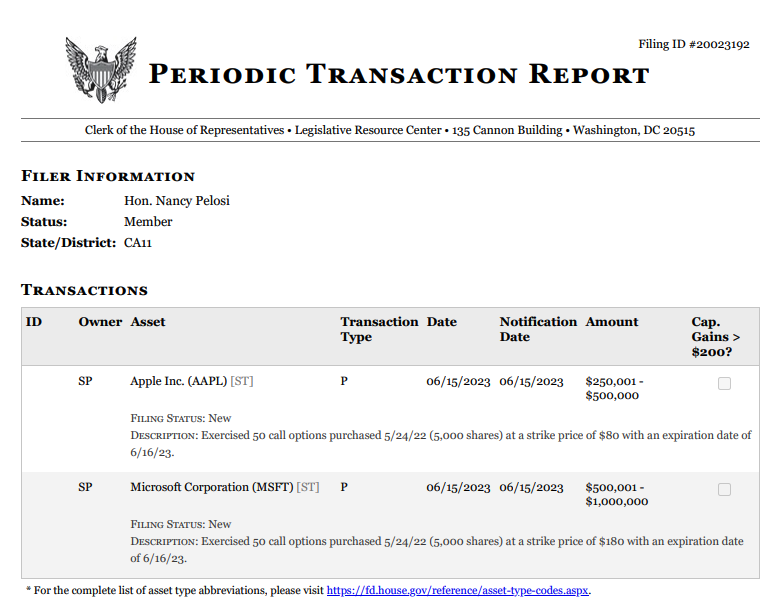
Two assumptions had to be made, and both are conservative:
- Transaction size. The filings give only a range, so the minimum of each disclosed range was used. That models the smallest position consistent with the disclosure, and therefore the smallest possible dollar gain.
- Instrument type. Where a filing disclosed an option contract, the analysis used the price of the underlying asset on that date instead of the option. Options are leveraged, so substituting the underlying stock produces a materially smaller return than the option itself would have.
Both choices understate rather than overstate the result. That is deliberate, but it also means the output is an approximation of a disclosed trading record, not a reproduction of an actual account.
What did the reconstructed portfolio hold?
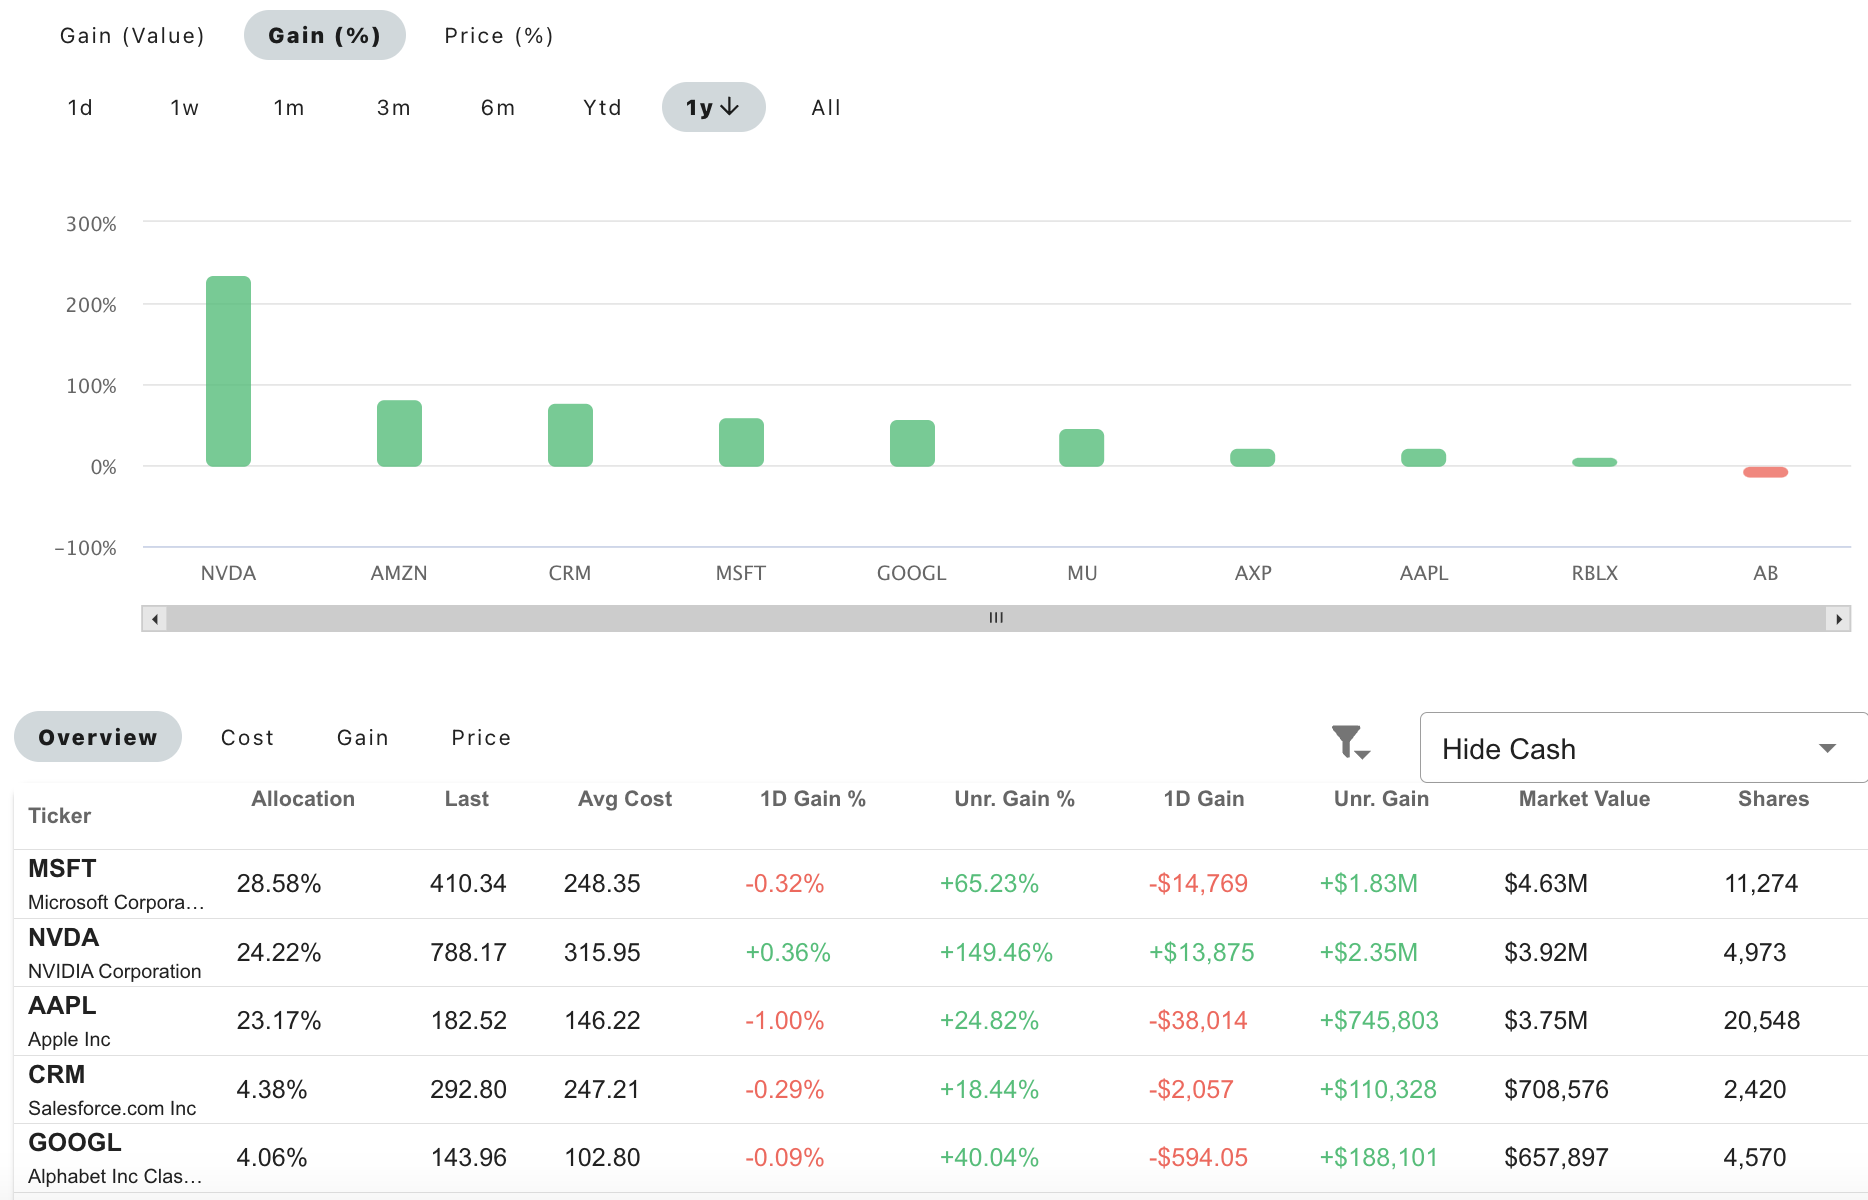
The portfolio reconstructed from Nancy Pelosi's filings was roughly 90% allocated to technology stocks in the February 2024 analysis, a concentration that explains most of its performance in that period.
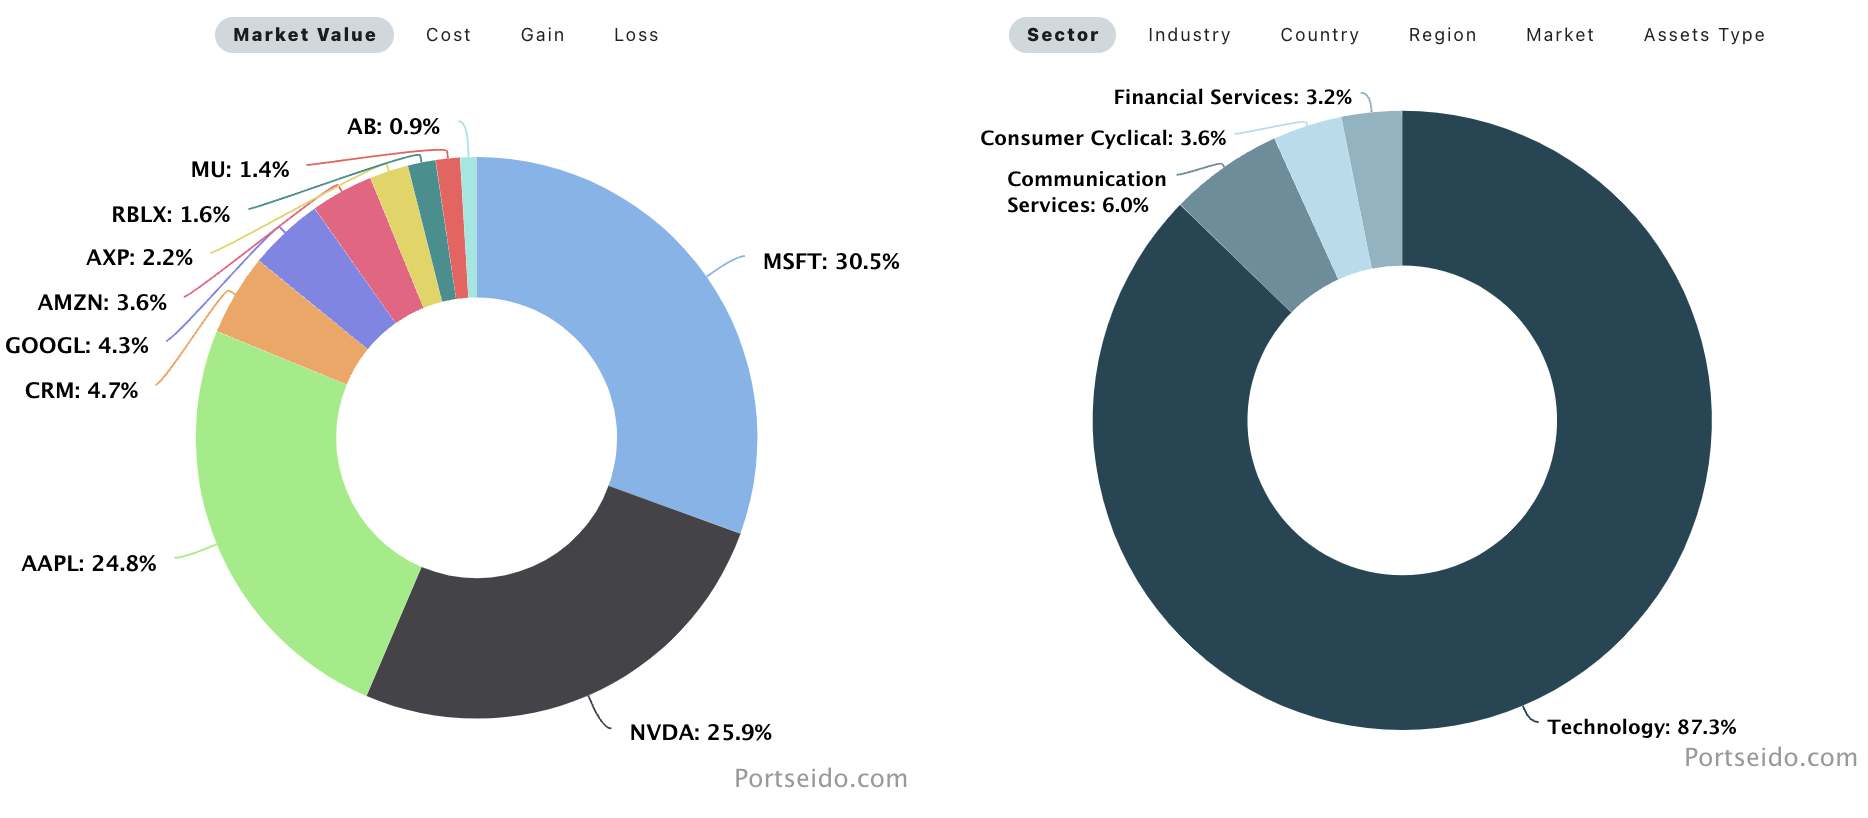
A 90% single-sector weighting is the dominant fact about this portfolio. Technology was the strongest-performing US sector from late 2023 into early 2024, so a portfolio allocated that way would have outperformed a broad index in that window largely as a consequence of the allocation itself. The same concentration works in reverse: in 2022, when technology fell hard, it would have fallen much further than the S&P 500. That is a general property of concentration rather than a comment on these particular filings, and it is why portfolio weight is worth tracking alongside returns.
One individual position illustrates the point. A disclosed purchase of Nvidia call options in November 2023 produced, in this reconstruction using the underlying stock price rather than the options, a return of 61% in roughly half a year.

What do congressional disclosures not tell you?
Congressional disclosures do not tell you the exact amount traded, the cost basis of a position, the size of the portfolio it sits in, or anything about the reasoning behind a trade.
The specific gaps are worth listing, because they set the ceiling on what any analysis of this data can claim:
| What the filing shows | What it does not show |
|---|---|
| Ticker symbol | Number of shares or contracts |
| Transaction date | The price actually paid |
| A broad dollar range | The exact amount |
| Buy, sell or exchange | Position size relative to total net worth |
| Filer, spouse or dependent child | Who made the investment decision |
There is also a timing gap. A report can be filed up to 45 days after the transaction, so by the time a trade is public the price has usually moved. Anyone reading disclosures as a source of ideas is reading a record of what happened, not a live signal.
Can investors follow congressional stock disclosures?
Investors can follow congressional stock disclosures, and some exchange-traded funds are built specifically to do so, but the 45-day reporting lag means the entry prices will differ from those in the filings.
One example is NANC, an ETF that debuted in February 2023 and tracks equities purchased by Democratic members of Congress. Funds of this kind rebuild their holdings from the same public periodic transaction reports described above, so they inherit the same lag and the same range-based estimation of position sizes.
Whether that is a sensible way to invest is a separate question from whether it is possible. A strategy assembled from disclosures is, in practice, a concentrated portfolio chosen by someone else's criteria, and its behaviour is driven by its sector weightings, as the roughly 90% technology allocation in this analysis shows. Measuring it against a benchmark over several years, rather than over a strong quarter, is the only way to see whether the approach adds anything over a broad index.
Frequently asked questions
What is the STOCK Act?
The Stop Trading on Congressional Knowledge Act of 2012 is a US law that prohibits members of Congress and federal employees from using non-public information gained through their positions for personal financial benefit, and requires them to publicly disclose covered securities transactions. Under the Act, transactions above $1,000 must be reported no later than 45 days after they occur, in publicly accessible periodic transaction reports.
How quickly are congressional stock trades made public?
Congressional stock trades become public when the periodic transaction report is filed, which can be up to 45 days after the transaction. In practice the delay ranges from a few days to the full window. That lag means the market price at the time of disclosure is often well away from the price in the filing, so the filings function as a historical record rather than a tradeable signal.
Why do different reports give different returns for the same portfolio?
Different reports give different returns because the underlying filings disclose dollar ranges rather than exact amounts, so every reconstruction has to choose an assumption. Using the minimum of each range, the midpoint, or the maximum produces materially different portfolio weights and therefore different returns. Start dates, dividend treatment and whether options are modelled as options or as the underlying stock all move the figure too.
Does a high return in one year mean a strategy is good?
A single year of high returns does not establish that a strategy is good, because a concentrated sector bet will beat the market whenever that sector leads and lose to it whenever the sector lags. Judging a strategy requires several years of returns measured against an appropriate benchmark, plus the drawdown it produced along the way.
Are congressional disclosures a complete picture of a member's investments?
Congressional disclosures are not a complete picture. They cover transactions in reportable securities above the threshold, but they do not show total portfolio size, cash holdings, cost basis, or assets outside the reporting requirements. A reconstructed portfolio built from them shows the disclosed trades in isolation, not the member's overall financial position.
How to track a portfolio built from public filings in Portseido
Portseido is the portfolio tracker used to reconstruct and measure the portfolio in this analysis, and it does the same for a personal one. It consolidates holdings across multiple brokers and currencies, calculates time-weighted and money-weighted returns from a transaction history, tracks cost basis, records dividends and yield on cost, benchmarks a portfolio against indices and ETFs, and shows allocation and drawdown.
Transactions can be entered manually or imported from a broker or a spreadsheet, which is what makes a filings-based reconstruction like this one possible in the first place. Portseido tracks and reports on your portfolio; it does not give buy or sell recommendations, and it takes no view on any public figure's trading. There is a free plan, and paid features come with a 14-day trial that does not need a credit card. Try Portseido free