

Treynor Ratio - What is it? How to calculate?
Article last updated: September 10, 2026
The Treynor Ratio is a risk-adjusted return measure that divides a portfolio's excess return by its beta. It was developed by Jack Treynor, who also named it the reward-to-volatility ratio, and it answers a narrower question than the better-known Sharpe Ratio: how well was an investor paid for the market risk they could not diversify away?
Key takeaways
- The Treynor Ratio measures how much return above the risk-free rate a portfolio earned for each unit of market risk, where market risk is measured by beta.
- The Treynor Ratio is calculated as the portfolio return minus the risk-free rate, divided by the portfolio's beta.
- A higher Treynor Ratio is better, because it means more excess return was produced per unit of market risk taken.
- The Treynor Ratio differs from the Sharpe Ratio only in its denominator: Treynor divides by beta (market risk), while Sharpe divides by standard deviation (total volatility).
- The Treynor Ratio becomes meaningless when beta is negative or close to zero, because dividing by a negative or tiny denominator produces a number that cannot be ranked.
What is the Treynor Ratio?
The Treynor Ratio, also known as the Treynor Index, the reward-to-volatility ratio or the Treynor measure, is a financial metric that measures portfolio performance adjusted for systematic risk. It tells an investor how much excess return a portfolio generated for each additional unit of market risk it carried.
Systematic risk here means market-wide risk — the risk that affects every asset at once and that cannot be removed by adding more holdings. The Treynor Ratio deliberately ignores company-specific risk on the assumption that a well-diversified investor has already eliminated it, so the only risk still worth pricing is exposure to the market itself.
That assumption makes it a fund-comparison tool: it scores a holding on the risk it contributes to a diversified portfolio, rather than on the volatility it would inflict on someone who owned nothing else.
How is the Treynor Ratio calculated?
The Treynor Ratio is calculated by subtracting the risk-free rate from the portfolio's return and dividing the result by the portfolio's beta. Two inputs and one divisor are all it needs.
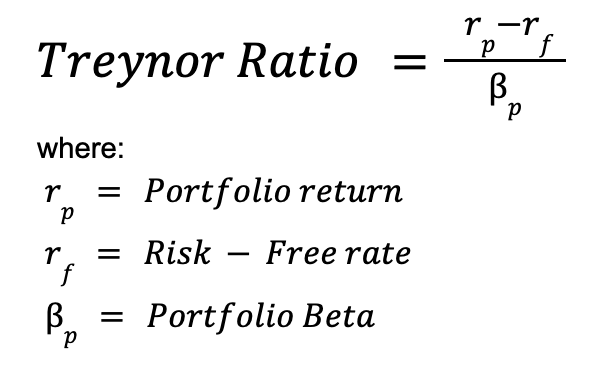
Treynor Ratio = (Portfolio Return - Risk-Free Rate) / Portfolio Beta
The Treynor Ratio calculation has two main components.
1. Excess return
Excess return is the portfolio's return above the risk-free rate, and it forms the numerator of the Treynor Ratio. The portfolio return is what the portfolio actually delivered over the period measured; the risk-free rate is the return on an asset assumed to carry no risk, usually a government bond of the same currency and a comparable maturity. Both figures must cover the same period, or the resulting ratio means nothing.
2. Beta
Beta (β) is a measure of how much a portfolio's return moves relative to its benchmark, and it forms the denominator of the Treynor Ratio. A beta of 1.0 means the portfolio has historically moved in line with the market, above 1.0 means it amplifies market moves, and below 1.0 means it dampens them.
Beta is estimated by regressing the portfolio's historical returns against the benchmark's, so the Treynor Ratio inherits whatever instability that estimate carries. Getting a defensible portfolio return is the other half of the work: Portseido calculates time-weighted and money-weighted returns from your transaction history across brokers and currencies, and benchmarks the portfolio against indices and ETFs, so both figures come from one consistent record.
Treynor Ratio calculation example
A portfolio that returned 12% over a year, against a 3% risk-free rate, with a beta of 1.2, has a Treynor Ratio of 0.075.
Working through the Treynor Ratio formula, which is the portfolio return minus the risk-free rate divided by the portfolio's beta:
Treynor Ratio = (12% - 3%) / 1.2 = 9% / 1.2 = 0.075
A Treynor Ratio of 0.075 means the portfolio produced 7.5 percentage points of excess return for each unit of market risk it carried.
Now compare a second portfolio that returned 15% over the same year with a beta of 1.8, measured against the same 3% risk-free rate:
| Portfolio | Return | Beta | Treynor Ratio |
|---|---|---|---|
| Portfolio A | 12% | 1.2 | (12% - 3%) / 1.2 = 0.075 |
| Portfolio B | 15% | 1.8 | (15% - 3%) / 1.8 = 0.067 |
Portfolio B earned more in absolute terms, but Portfolio A converted market risk into return more efficiently. An investor adding either one to an already diversified portfolio would be better served by A, because B's extra 3 percentage points of return came at a disproportionate cost in market exposure.
Is a higher or lower Treynor Ratio better?
A higher Treynor Ratio is better, because it means the portfolio generated more return above the risk-free rate for each unit of market risk it took on. There is no absolute threshold at which a Treynor Ratio becomes "good" in the way a Sharpe Ratio above 1.0 is conventionally considered decent.
Read a Treynor Ratio against three references rather than in isolation:
- A peer with a similar mandate. Compare funds in the same asset class, over the same period, with the same risk-free rate.
- The benchmark itself. The market's own Treynor Ratio is its excess return divided by a beta of 1.0, so it reduces to the market's excess return. Beating that is the bar.
- The same portfolio over time. A Treynor Ratio that falls while the headline return rises means the portfolio is buying its returns with more market risk.
A negative Treynor Ratio caused by a return below the risk-free rate means the portfolio took market risk and was worse off than holding a government bond.
Treynor Ratio vs Sharpe Ratio
The Treynor Ratio and the Sharpe Ratio are built identically except for their denominator: the Treynor Ratio divides excess return by beta, while the Sharpe Ratio divides it by the standard deviation of returns.
| Treynor Ratio | Sharpe Ratio | |
|---|---|---|
| Formula | (Return - Risk-Free Rate) / Beta | (Return - Risk-Free Rate) / Standard Deviation |
| Risk it prices | Systematic risk only (market exposure) | Total risk (all volatility) |
| Assumes | The investor is already diversified | The portfolio may be all the investor owns |
| Best used for | Ranking a fund or holding that will sit inside a wider portfolio | Judging a standalone portfolio |
Use the Sharpe Ratio to judge a portfolio that represents someone's whole investment position, because total volatility is what its owner actually experiences. Use the Treynor Ratio when the holding sits inside an already diversified portfolio, since only its market risk survives diversification.
The two ratios can rank the same funds differently, and that is informative rather than contradictory. A fund with high company-specific volatility but low market sensitivity scores poorly on Sharpe and well on Treynor — exactly the profile of a holding that looks wild alone and behaves calmly inside a diversified portfolio.
How does the Treynor Ratio compare with alpha?
The Treynor Ratio and alpha both adjust return for market risk, but the Treynor Ratio is a ratio of excess return per unit of beta, while alpha is a residual measured in percentage points.
| Measure | What it divides by | Question it answers |
|---|---|---|
| Treynor Ratio | Beta (market sensitivity) | How much excess return per unit of market risk? |
| Alpha | Not a ratio; a residual | How much return beat what the risk taken predicted? |
Both use the same two inputs, portfolio return and beta, so they usually agree on direction. They differ in what they report: alpha gives the size of the outperformance in percentage points, while the unitless Treynor Ratio ranks investments cleanly without saying what the difference was worth.
What are the limitations of the Treynor Ratio?
The Treynor Ratio is a useful risk-adjusted return measure, but no single metric is complete. Three limitations matter in practice.
1. Negative beta breaks the ratio
The Treynor Ratio loses its meaning when beta is negative, because dividing a positive excess return by a negative number produces a negative ratio that suggests poor performance when the opposite happened. A portfolio returning 8% against a 3% risk-free rate with a beta of -0.5 produces (8% - 3%) / -0.5 = -0.10, a result that ranks it below a portfolio that lost money. Beta must be positive for the Treynor Ratio to be interpretable, and a beta near zero inflates it toward infinity.
2. Beta is an imperfect risk measure
Beta quantifies an investment's return volatility relative to its benchmark, which may not capture its full risk profile. Beta is estimated from historical returns, so it can misstate current risk when a business changes, and it treats upside volatility as risk. Relying on it alone overlooks credit risk, liquidity risk and the risk of permanent capital loss, none of which appear in the Treynor Ratio. Reading it alongside the actual drawdown a portfolio suffered fills part of that gap.
3. The Treynor Ratio is an ordinal measure
The Treynor Ratio ranks portfolios rather than quantifying the gap between them. It tells you which portfolio delivered more excess return per unit of market risk, but the difference between 0.075 and 0.067 has no direct interpretation in money terms. It is a sorting tool, not a measure of magnitude.
Frequently asked questions
Can the Treynor Ratio be negative?
Yes, and it happens for two very different reasons. A Treynor Ratio is negative when the portfolio returned less than the risk-free rate, which is genuinely poor performance. It is also negative when beta is negative but the return was fine, which is a quirk of the formula rather than a verdict. Always check which case you are in before interpreting a negative Treynor Ratio.
What is a good Treynor Ratio value?
There is no fixed threshold, because the Treynor Ratio scales with the excess return available in a given market and period. A Treynor Ratio is only meaningful next to a comparison: another fund measured the same way over the same window, or the benchmark's own excess return. Any Treynor Ratio quoted without its period, benchmark and risk-free rate cannot be judged.
Does the Treynor Ratio need to be annualised?
Yes, if you intend to compare it with published figures, which are conventionally quoted on an annual basis. Annualise the return and the risk-free rate before dividing by beta, rather than annualising the finished ratio. Beta itself does not need annualising, since it is a unitless sensitivity rather than a rate.
Which benchmark should be used for the beta in a Treynor Ratio?
Use the index that most closely matches what the portfolio actually holds, in the same currency and over the same period as the return figure. A portfolio of US large-cap stocks belongs against a US large-cap index. A mismatched benchmark distorts beta, and because beta is the entire denominator, it distorts the Treynor Ratio directly.
How to track portfolio return and benchmarks in Portseido
Portseido is a portfolio tracker that supplies the return side of any risk-adjusted calculation. It consolidates holdings across brokers and currencies, calculates time-weighted and money-weighted returns from your transaction history, tracks cost basis, dividends and yield on cost, reports allocation and drawdown, and benchmarks the portfolio against indices and ETFs so you can see your performance next to the market you measure it against.
Portseido does not calculate the Treynor Ratio or estimate beta. It tracks and reports on your portfolio; it does not give buy or sell recommendations. There is a free plan, and paid features come with a 14-day trial that does not need a credit card. Try Portseido free